
- Home >
- Stock Photos >
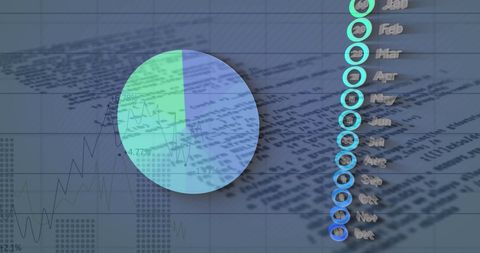
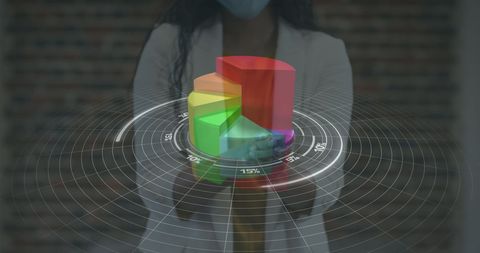
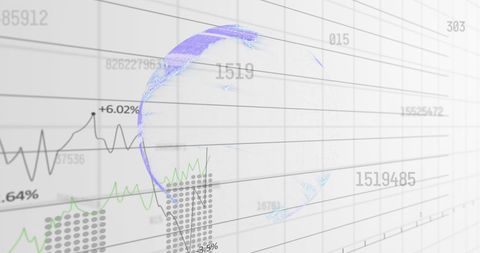
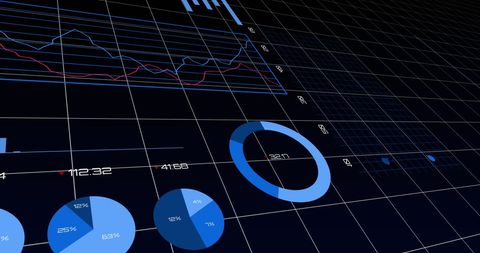
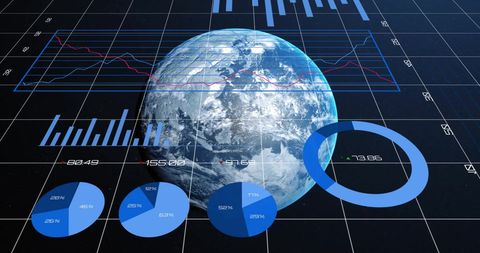
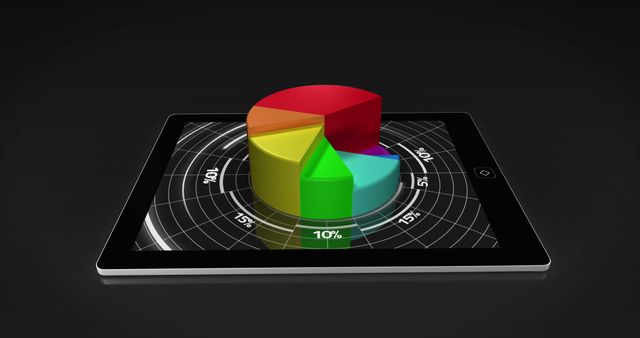
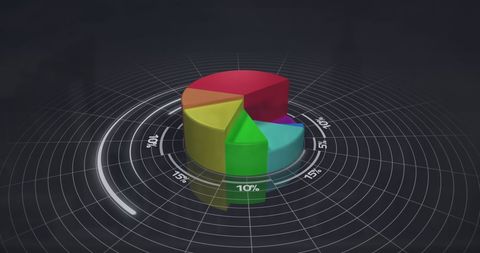
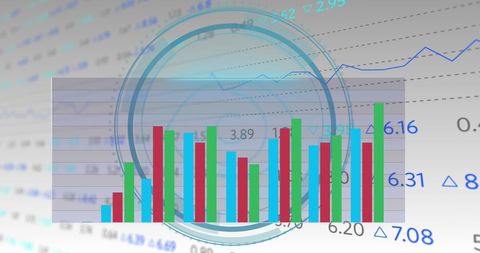
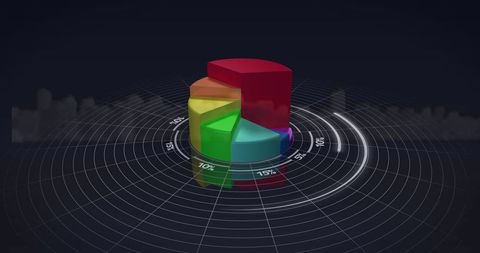
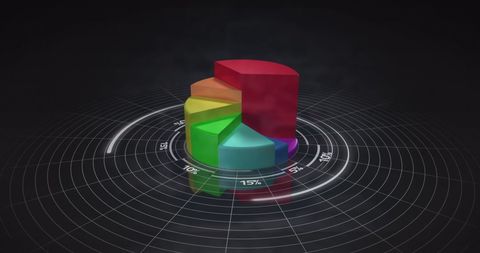
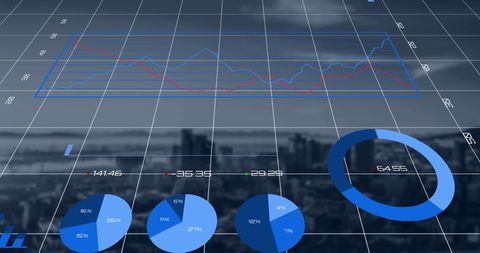
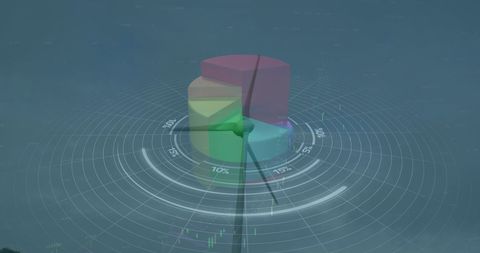
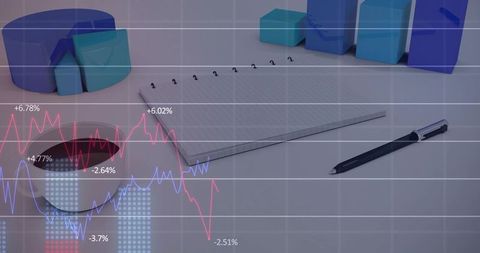
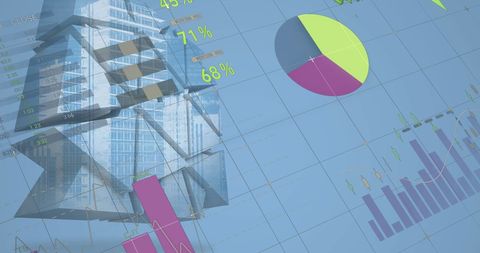
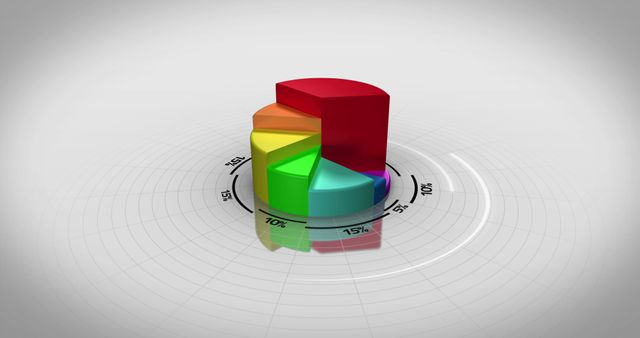
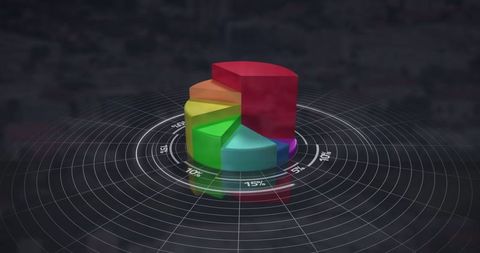
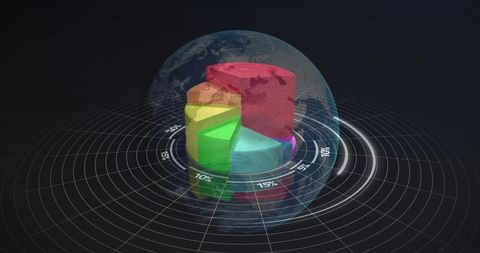
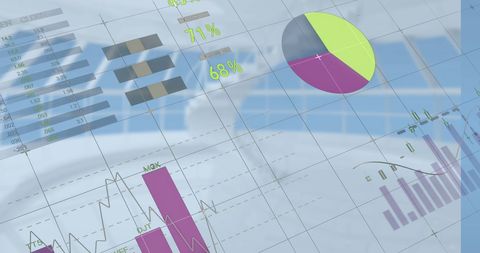
- Financial Data Processing with 3D Graphs on Blue Background
Financial Data Processing with 3D Graphs on Blue Background Image
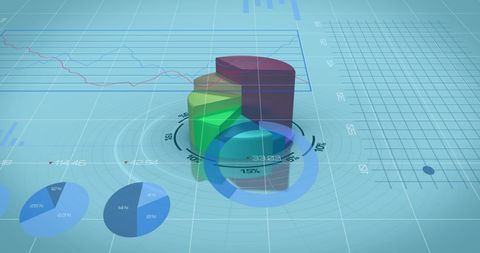
3D financial graphs and charts appearing over a blue grid background indicate complex data analysis and decision-making processes. Useful for presentations and reports related to finance, business strategy, and global market trends. Ideal for illustrating concepts of economic analysis, financial tools, and digital data processing in a modern and tech-savvy framework.
Powered by 


downloads
Tags:
More
Credit Photo
If you would like to credit the Photo, here are some ways you can do so
Text Link
photo Link
<span class="text-link">
<span>
<a target="_blank" href=https://pikwizard.com/photo/financial-data-processing-with-3d-graphs-on-blue-background/b89fd1092b197f5be8e1589a934e5e80/>PikWizard</a>
</span>
</span>
<span class="image-link">
<span
style="margin: 0 0 20px 0; display: inline-block; vertical-align: middle; width: 100%;"
>
<a
target="_blank"
href="https://pikwizard.com/photo/financial-data-processing-with-3d-graphs-on-blue-background/b89fd1092b197f5be8e1589a934e5e80/"
style="text-decoration: none; font-size: 10px; margin: 0;"
>
<img src="https://pikwizard.com/pw/medium/b89fd1092b197f5be8e1589a934e5e80.jpg" style="margin: 0; width: 100%;" alt="" />
<p style="font-size: 12px; margin: 0;">PikWizard</p>
</a>
</span>
</span>
Free (free of charge)
Free for personal and commercial use.
Author: People Creations
Similar Free Stock Images

Premium


Premium


Premium


Premium


Premium


Premium


Premium

Premium


Premium

Premium


Premium


Premium


Premium


Premium

Premium


Premium


Premium


Premium


Premium

Premium


Premium


Premium


Premium


Premium


Premium


Explore More Free Stock Images