1. Home > 
  2. Stock Photos > 
  3. Financial Data Processing with Analytics Graphs and Digital Charts

Financial Data Processing with Analytics Graphs and Digital Charts Image

Financial Data Processing with Analytics Graphs and Digital Charts

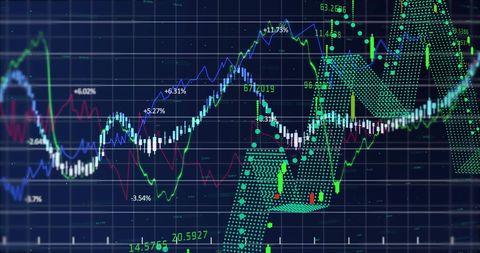
Depicts financial data and analytics displayed as dynamic digital graphs over dark grid backdrop, capturing the essence of global finance and data processing. Ideal for articles or presentations about data analysis, investments, financial markets, and technology in finance.

Powered by Adobe logo
A business professional focuses on analyzing data and trends using digital graphs and charts, highlighting growth and opportunities in a modern office setting. Copula - Powered by AdobeSales data analysis dashboard showing performance, trends, and insights. Sales data tracks growth, supports decisions, sales data boosts strategy, and sales data drives performance. - Powered by AdobeRobotic Figure Analyzing Complex Financial Visualizations AI Analyst Monitoring Data Across Multiple Blue Screens  - Powered by AdobeDigital blue stock market analysis graph showing fluctuation and data processing on screen display. - Powered by AdobeBusinesswoman working on laptop with analytics graphs displayed on screen inside warehouse. Concept of logistics, supply chain, inventory management, shipping, ecommerce and distribution. - Powered by Adobe

Credit Photo

If you would like to credit the Photo, here are some ways you can do so

Free (free of charge)

Free for personal and commercial use.

Author: Awesome Content

Similar Free Stock Images

Abstract Digital Graphs Showing Financial Data Analysis
Premium
Data center servers with cityscape view. Financial graph and dashboard interface over blur city. Global business and technology internet connection.
Economic and Political Factors Influence Investment Trends
Financial Data Flow against Urban Skyline Backdrop
Fluctuating Financial Graph with Red Line on Green Grid
Falling Line Graph on Navy Background Illustrating Economic Decline
Premium
Vibrant workspace showcasing data analysis with colorful charts and graphs on a large digital dashboard display
Digital Finance: Modern Stock Market Analysis Display
Innovative Data Analysis with Dynamic Line Graph and Digital Elements
Global Data Analytics on Digital Grid Interface
Abstract Financial Graph with Rising Waves on Red Gradient
Premium
Man wearing augmented reality glasses analyzes futuristic digital data market trends and financial charts
Data Trends and Analysis on 3D Digital Grid
Dynamic Data Visualization and Financial Growth Curves
European Market Data Overlay with EU Flag and Financial Graphs
Dynamic Stock Market Graphs Over Digital Interface
Premium
Futuristic holographic data hub with glowing blue towers and floating analytical dashboards displaying charts and graphs.
Digital Globe and Data Chart Revolutionizing Global Business Concepts
Digital Data Visualization with Trend Lines and Percentage Changes
Abstract Data Visualization with Dynamic Charts and Graphs
Rising Financial Data Graph on Digital Grid Background
Premium
Data analysis dashboard showing charts and graphs
Digital Financial Data and AI Illustration Networking Globally
NFT Financial Data Visualization with Digital Graph Overlay
Financial Data Analysis and Digital Interface Concept
Dynamic Financial Graphs Overlaying Urban Skyline
Premium
A digital representation showing the intersection of technology and finance, this image showcases an AI-enhanced stock chart, AI-Driven Stock Chart
Abstract Financial Data Processing and Analysis Interface
Dynamic Financial Data Chart Showing Trend Analysis
Dynamic Stock Market Chart with Fluctuating Trends and Data Points
Digital Graphs and Data Visualization on Green Background
Line Graphs on Digital Background Show Financial Data Trends
Digital Financial Data Overlaying City Skyline at Dusk
Premium
Business analysis reports with charts and graphs. Integrated content management platform. Digital document automation. Businessperson holding reports.
Futuristic Digital Data Analytics Interface Display
Dynamic Financial Graph Over Red Background
Rising Digital Graph and Data Visualizations on Black Background
Abstract Financial Data Visualization in Server Room
Premium
Man in smart glasses interacts with futuristic data dashboards and AI analytics interface. Concept of AI-powered workflows, data science, cybersecurity, and digital innovation. Collage
Analyzing Accelerating Data Trends on Grid with Tech Insights
Financial Data Line Graph on Digital Display
Dynamic Stock Market Graph Displaying Surging Growth
Dynamic Data Graphs on Digital Interface Background
Premium
Man analyzes data with holographic interfaces on his laptop representing business intelligence for data driven decisions, insights and strategy.
Financial Graph Displayed Over City Skyline at Sunset
Digital Financial Data Graph Showcasing Market Trends
Financial Data Analysis with Declining Trends
Dynamic Financial Data Visualizations on Grid Interface
Premium
Business person analyzing financial data and reports for quality management and compliance with digital icons
Futuristic Global Finance Chart with Rotating Globe Animation
Rising Graph Line on Digital Green Grid Background
Dynamic Financial Data Visualization on Digital Grid Background
Digital Data Prozessing with Global Interface Design
Premium
Strategic business planning and growth forecasting. Hand touches a digital screen focusing on the customer target icon amidst futuristic data analysis and investment charts for 2025 success.
Dynamic Financial Chart with Upward Growth Arrow
Dynamic Financial Graphs Overlaying Modern Cityscape
Cityscape with Digital Stock Market Graphs and Statistics
Dynamic Financial Data on Digital Screen
Premium
Analyzing business data on a futuristic monitor dashboard
Financial Stock Market Data Visualization with Declining Trends
Financial Growth Stock Nikkei in Urban City Skyline
Digital Stock Market Graph Red Trendline on Green Background
Graph Lines Portraying Financial Data Trends
Abstract DNA Helix Digital Network
Financial Data Charts with World Map on Blue Digital Background
Premium
Businessperson using digital smartphone and laptop to manage global tax system. Concept of online tax filing, financial technology, remote accounting software and international taxation management.
Dynamic Line Chart with Histogram on Digital Grid Background
Digital Interface Showing Global Business Data Analytics
Data Analytics and Financial Growth Indicators
Financial Data Charts in Shimmering Blue Digital Space
Premium
A high-tech control room with digital displays showcasing financial data and analytical insights. The image shows several monitors displaying graphs and charts, creating a dynamic visual
Digital Financial Data with Graph and Grid Patterns
Financial Graph Analysis on Green Grid Background
Dynamic Stagflation Concept Displaying Economic Burdens
Dynamic Glowing Digital Graphs on 3D Grid Background
Premium
Financial data processing through advanced analytics in a modern office setting with digital interfaces, financial data processing over diverse business people in office
Analyzing Stock Market Trends with Dynamic Graphs and Data
Data Analytics Graphs on Digital Interface Background
Dynamic Business Data and Cityscape Visualization
Digital Finance Chart Overlaying Globe Background
Premium
A business professional examines various data graphs and reports displayed on a digital interface, portraying modern analysis techniques in a corporate environment. Impute
Financial Graphs with Social Media Analytics on Digital Chart
Abstract Digital Charts with Social Media Metrics Rising
Dynamic Green Line Graph Depicting Financial Data
Global Networking Concept with 6G Technology Display
Premium
Businessman analyze and visualize complex information on a virtual screen using AI to process data. Big data technology and data science.Data flow.Digital neural network.artificial intelligence
Interactive Social Media Metrics Overlaid on Business Data Graph
Line Graph Illustrating Data Trend on Green Digital Background
Dynamic Financial Data Overlaid on Grid Background
Financial Data with Molecular Background Concept
Premium
Person typing on laptop with holographic data charts and graphs overlay analytics statistics
Financial Growth Statistic Data Processing Over Urban Cityscape
Futuristic Digital Graph Showing Data Trends on Analytic Interface
Financial Data Overlay on Cityscape Visualizing Market Trends
Financial Data Visualization with Cityscape Overlay
Financial Data Graph Rendering Global Market Trends
Rising Financial Graph on Dark Grid Background
Premium
Global data processing and financial market analysis
Digital Interface with Global Financial Graphs Background
Global Economy Displaying Growth Trends with Ukraine-NATO Financial Outlook
Fluctuating Digital Stock Market Data Chart
Global Financial Markets Chart with Grid Overlay
Premium
Big data and AI technology, Business intelligence and AI data science, Automating data processing, Machine learning and business intelligence, AI driven data processing, KPI performance monitoring.
Futuristic Graph with Digital Globe Symbolizing Global Technology Connections
Digital Representation of Slumpflation in Global Economy
Analyzing Data Trends on Digital Graph Interface
Dynamic Financial Growth Digital Chart Display
Premium
Man in glasses looks at multiple computer screens. He is holding smartphone in hands. Display shows charts and graphs with financial info. Office worker focused on data.
Abstract Digital Finance Chart Showing Fluctuating Graph Lines
Digital Stock Market Green Graph Against Dark Trading Board
Dynamic Forex Trading Graphs with Increasing Numbers
Colorful Data Visualization on Dark Background
Premium
Woman in glasses looking at futuristic digital interface with charts and data image
City Skyline with Overlay of Financial Market Trends
Data Visualization on Security Shield Interface for Cyber Security
Financial Data Analysis Vibrant Graphs on Blue Background
Digital Graph Displaying Dynamic Data Analysis
Premium
Data science business analysis and strategy big data conceptBusiness teamwork analyzing financial graph on virtual touch screen futuristic technology solution for business development : Generative AI
Financial Data Analysis with Futuristic Technology Interface
Fluctuating Financial Graph on Green Grid Background
Digital Data Processing with Graph and Grid Technology Interface
Dynamic Financial Data Displays Stock Market Trends
Premium
Internal audit concept with digital technology interface showing business analysis and data security on a dark blue background for financial compliance and risk management
Digital Data Processing with Chart in Futuristic Interface