
- Home >
- Stock Photos >
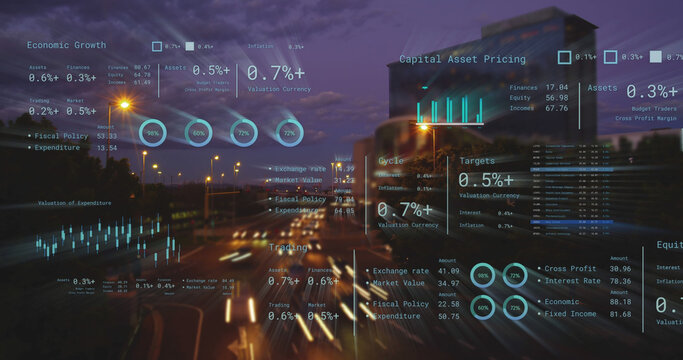
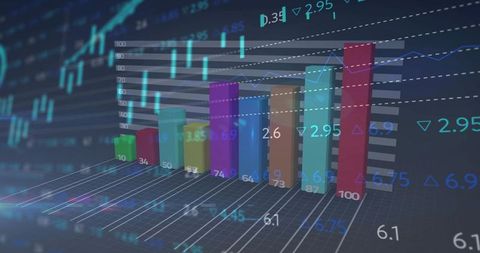
- Financial Data Processing with Bar Charts and Line Graphs
Financial Data Processing with Bar Charts and Line Graphs Image

Visual representation of financial data processing featuring colorful bar and line graphs overlaid with digital interface elements. Suitable for projects related to business analytics, technology solutions, finance industry, or data science presentations.
Powered by 


downloads
Tags:
More
Credit Photo
If you would like to credit the Photo, here are some ways you can do so
Text Link
photo Link
<span class="text-link">
<span>
<a target="_blank" href=https://pikwizard.com/photo/financial-data-processing-with-bar-charts-and-line-graphs/750da3fbd1b1ea280bc4527bec4c7dfb/>PikWizard</a>
</span>
</span>
<span class="image-link">
<span
style="margin: 0 0 20px 0; display: inline-block; vertical-align: middle; width: 100%;"
>
<a
target="_blank"
href="https://pikwizard.com/photo/financial-data-processing-with-bar-charts-and-line-graphs/750da3fbd1b1ea280bc4527bec4c7dfb/"
style="text-decoration: none; font-size: 10px; margin: 0;"
>
<img src="https://pikwizard.com/pw/medium/750da3fbd1b1ea280bc4527bec4c7dfb.jpg" style="margin: 0; width: 100%;" alt="" />
<p style="font-size: 12px; margin: 0;">PikWizard</p>
</a>
</span>
</span>
Free (free of charge)
Free for personal and commercial use.
Author: Authentic Images
Similar Free Stock Images

Premium


Premium


Premium


Premium


Premium


Premium


Premium


Premium

Premium


Premium


Premium


Premium


Premium


Premium


Premium


Premium


Premium


Premium


Premium


Premium


Premium


Premium


Premium


Premium


Premium


Explore More Free Stock Images