
- Home >
- Stock Photos >
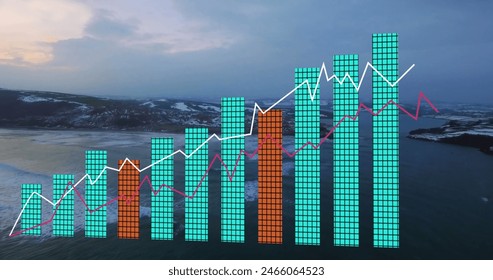
- Financial Data Processing with Blue Background Overlay
Financial Data Processing with Blue Background Overlay Image

Dynamic portrayal of financial data processing showing a vibrant interface with a blue digital background. Features line graphs symbolizing market trends, and abstract coding suggesting advanced computational techniques in the financial sector. Ideal for use in topics related to finance, data analysis, tech industries, or modern business presentations.
Powered by  - Get 15% off with code: PIKWIZARD15


downloads
Tags:
More
Credit Photo
If you would like to credit the Photo, here are some ways you can do so
Text Link
photo Link
<span class="text-link">
<span>
<a target="_blank" href=https://pikwizard.com/photo/financial-data-processing-with-blue-background-overlay/d0c2f30ff0323ffd2f6a261499171e6d/>PikWizard</a>
</span>
</span>
<span class="image-link">
<span
style="margin: 0 0 20px 0; display: inline-block; vertical-align: middle; width: 100%;"
>
<a
target="_blank"
href="https://pikwizard.com/photo/financial-data-processing-with-blue-background-overlay/d0c2f30ff0323ffd2f6a261499171e6d/"
style="text-decoration: none; font-size: 10px; margin: 0;"
>
<img src="https://pikwizard.com/pw/medium/d0c2f30ff0323ffd2f6a261499171e6d.jpg" style="margin: 0; width: 100%;" alt="" />
<p style="font-size: 12px; margin: 0;">PikWizard</p>
</a>
</span>
</span>
Free (free of charge)
Free for personal and commercial use.
Author: Awesome Content
Similar Free Stock Images

Premium


Premium


Premium


Premium


Premium


Premium


Premium


Premium
Premium

Premium


Premium


Premium

Premium


Premium


Premium


Premium


Premium


Premium


Premium


Premium


Premium


Premium


Premium


Premium


Premium


Explore More Free Stock Images