
- Home >
- Stock Photos >
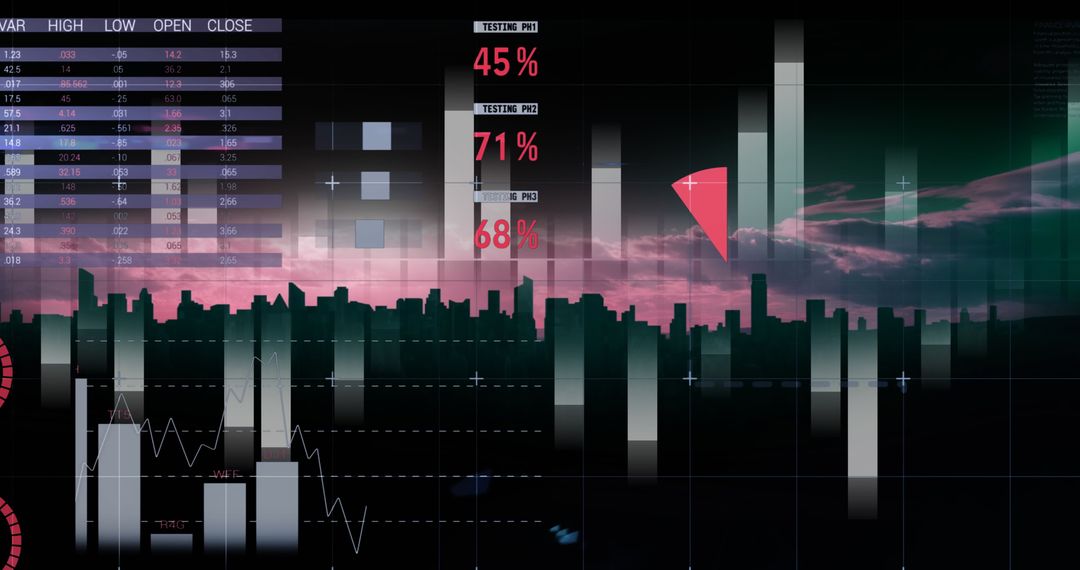
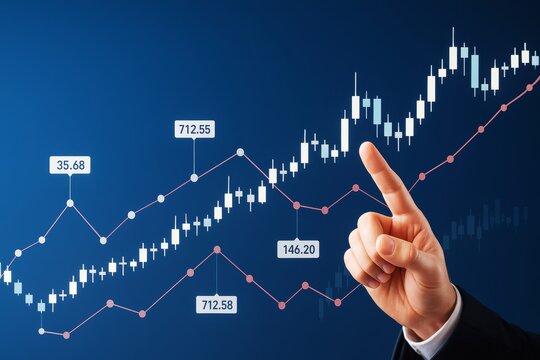
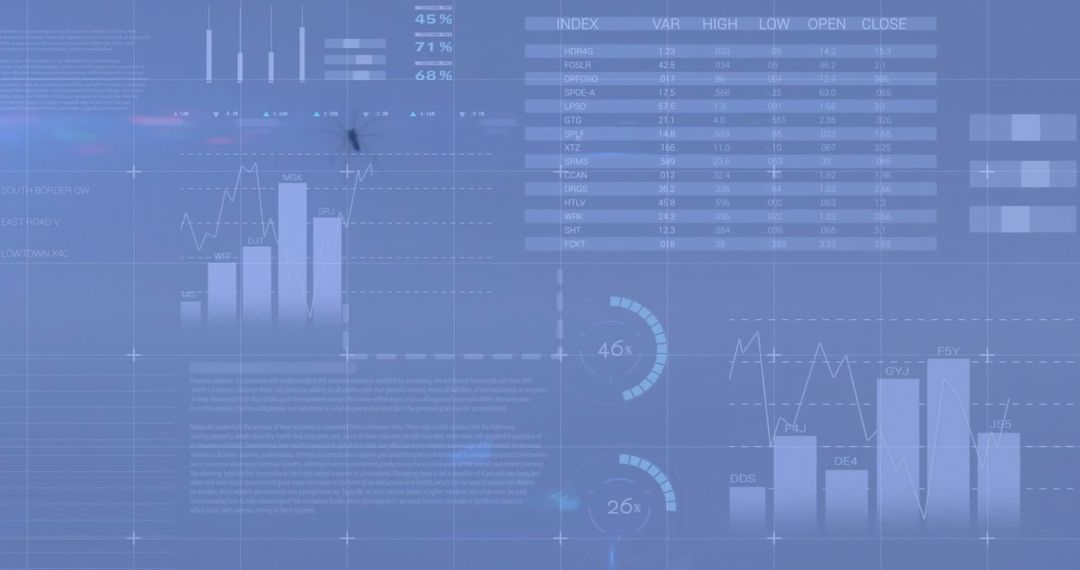
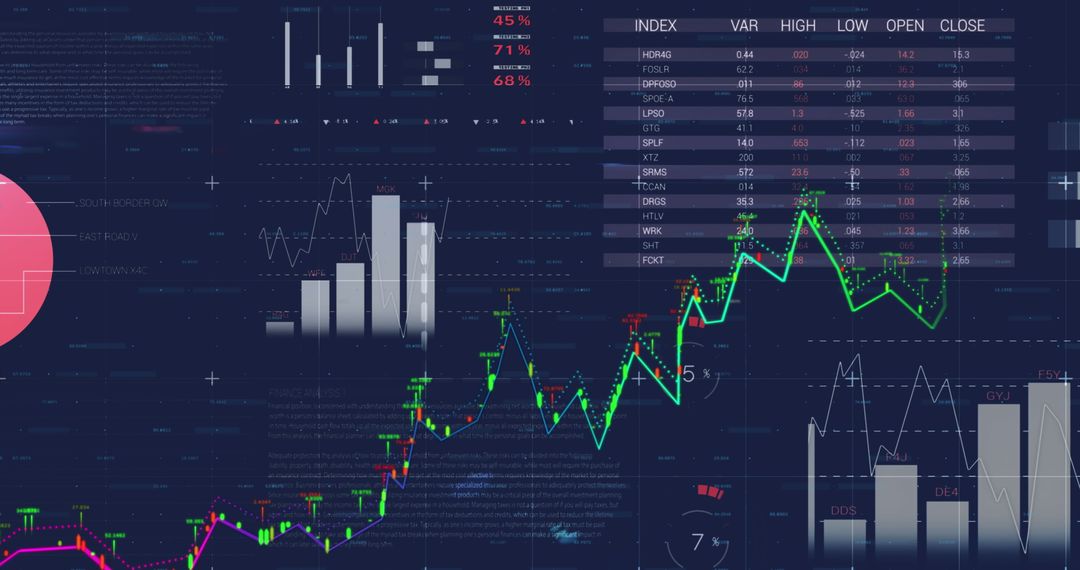
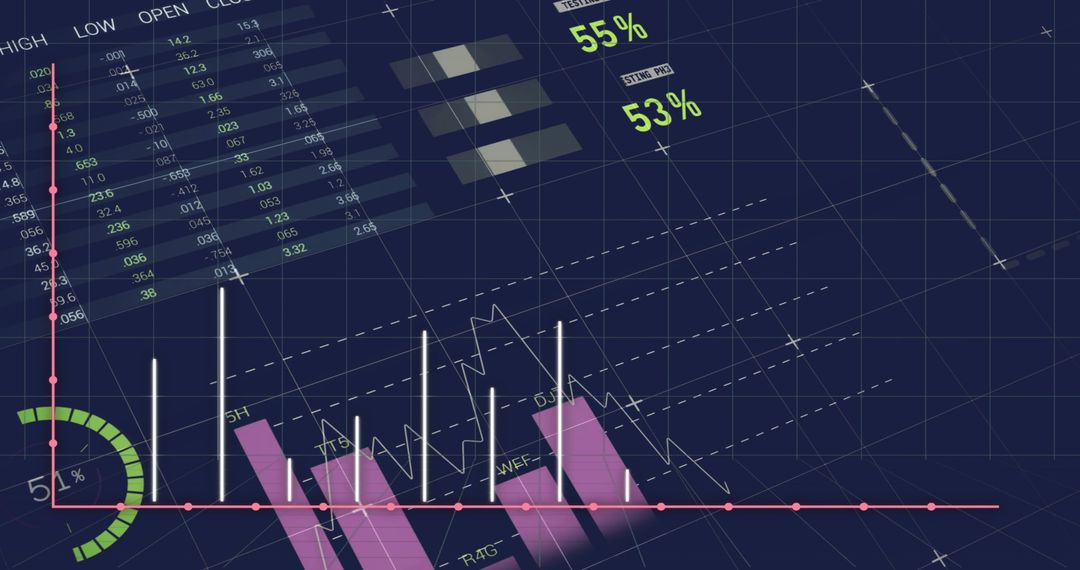
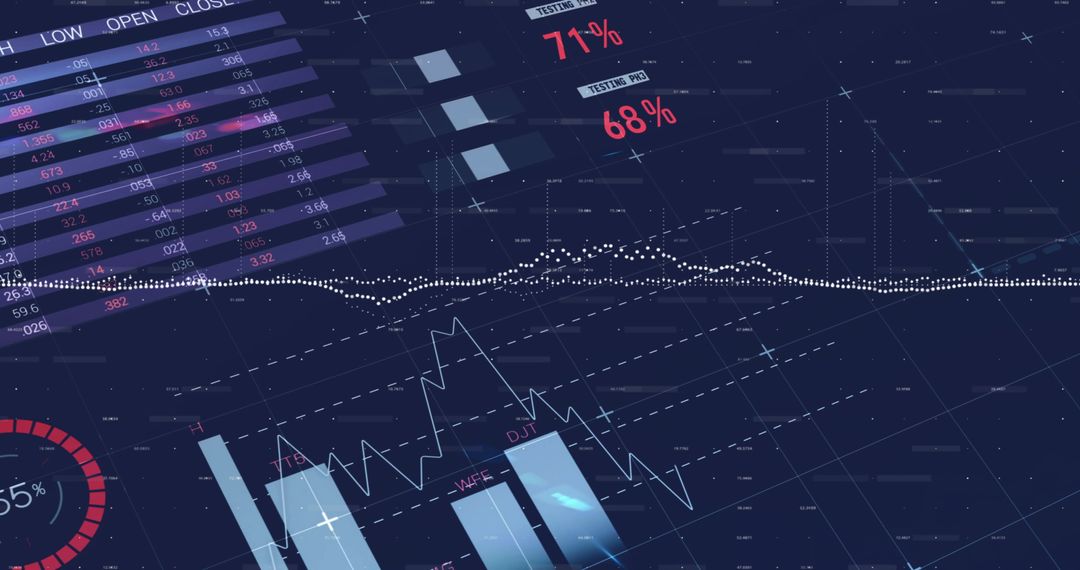
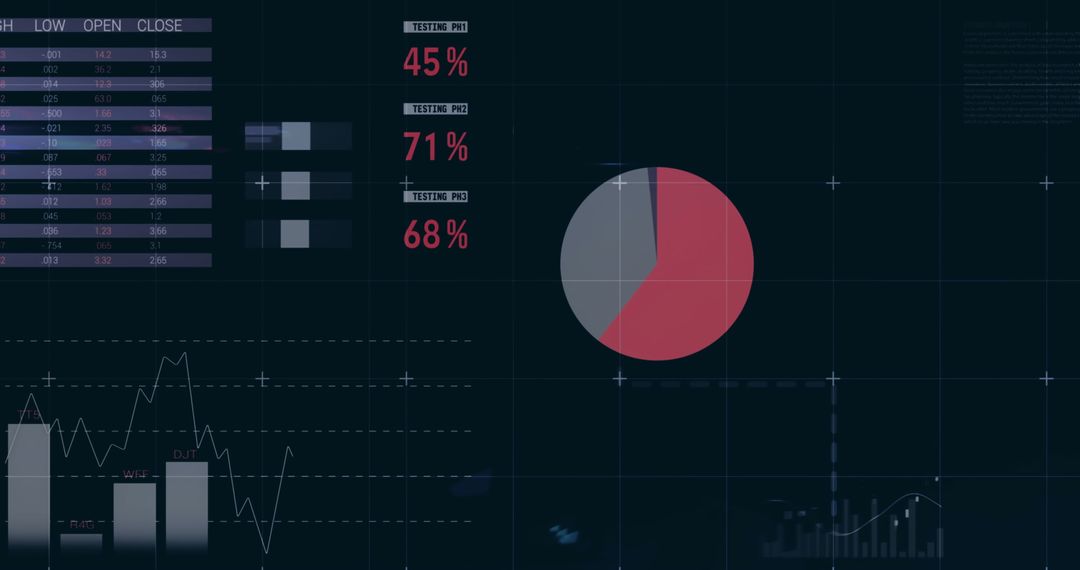
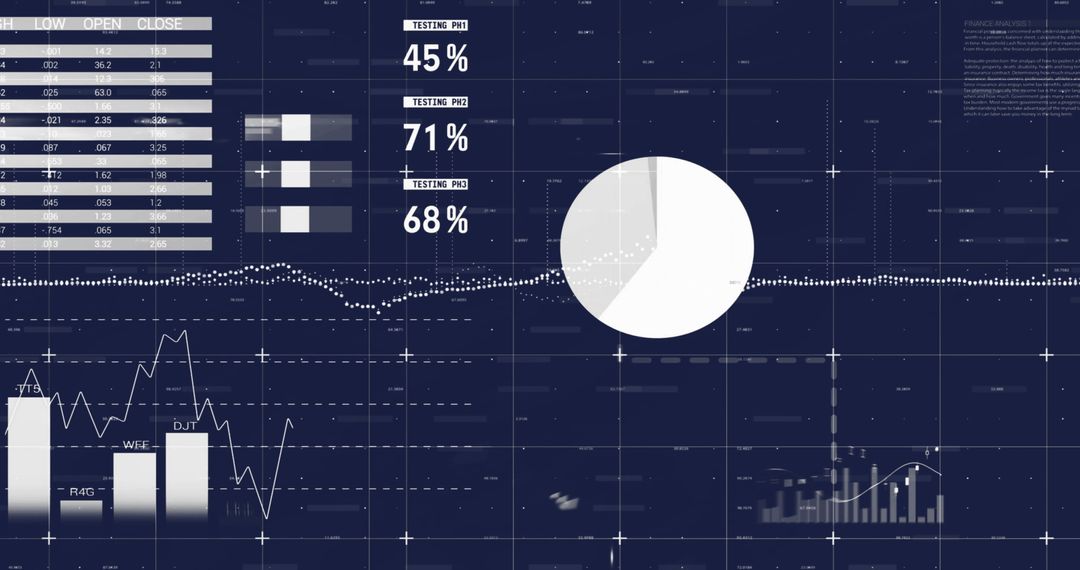
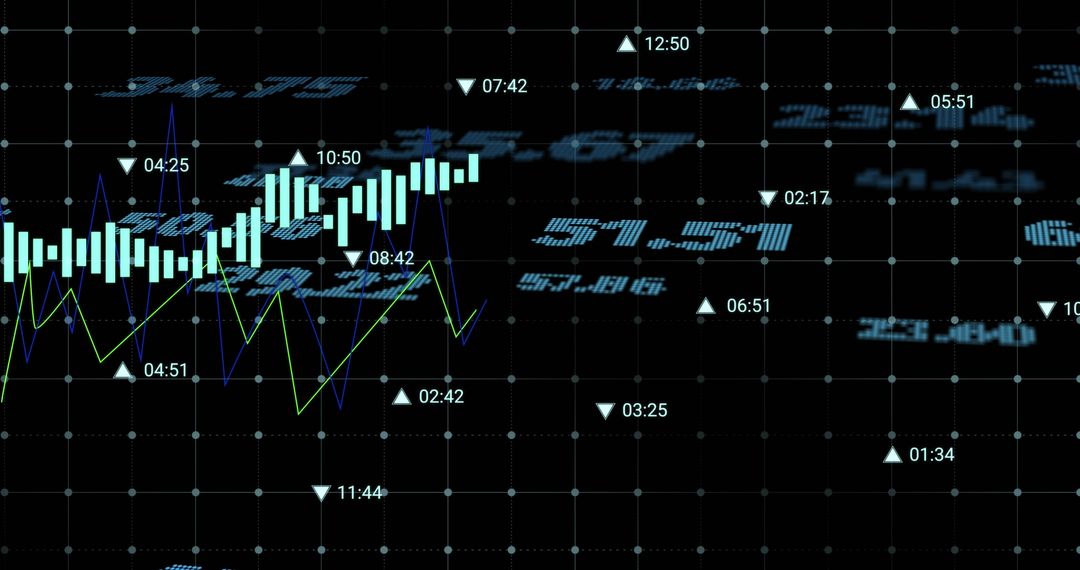
- Financial Data Processing with Charts and Graphics on Digital Blue Background
Financial Data Processing with Charts and Graphics on Digital Blue Background Image

This visual depicts financial data processing with a range of numeric values, graphs, and charts presented on a digital blue background. Ideal for use in contexts such as financial articles, business presentations, and educational materials related to stock market analysis, business finance, or investment strategies. Useful for showcasing concepts like economic trends, data modeling, or transactions in the realm of global commerce.
Powered by 


2
downloads
downloads
Tags:
More
Credit Photo
If you would like to credit the Photo, here are some ways you can do so
Text Link
photo Link
<span class="text-link">
<span>
<a target="_blank" href=https://pikwizard.com/photo/financial-data-processing-with-charts-and-graphics-on-digital-blue-background/87817899f050833ac06a7d537f493dac/>PikWizard</a>
</span>
</span>
<span class="image-link">
<span
style="margin: 0 0 20px 0; display: inline-block; vertical-align: middle; width: 100%;"
>
<a
target="_blank"
href="https://pikwizard.com/photo/financial-data-processing-with-charts-and-graphics-on-digital-blue-background/87817899f050833ac06a7d537f493dac/"
style="text-decoration: none; font-size: 10px; margin: 0;"
>
<img src="https://pikwizard.com/pw/medium/87817899f050833ac06a7d537f493dac.jpg" style="margin: 0; width: 100%;" alt="" />
<p style="font-size: 12px; margin: 0;">PikWizard</p>
</a>
</span>
</span>
Free (free of charge)
Free for personal and commercial use.
Author: People Creations
Similar Free Stock Images

Premium


Premium


Premium


Premium


Premium


Premium


Premium


Premium


Premium


Premium


Premium


Premium


Premium


Premium


Premium


Premium


Premium


Premium


Premium


Premium


Premium


Premium


Premium


Premium

