
- Home >
- Stock Photos >
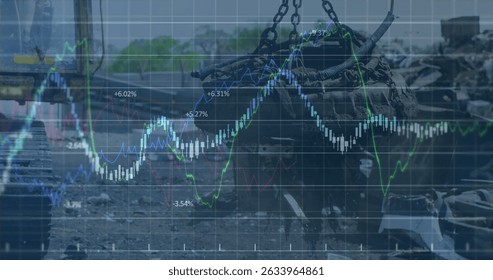
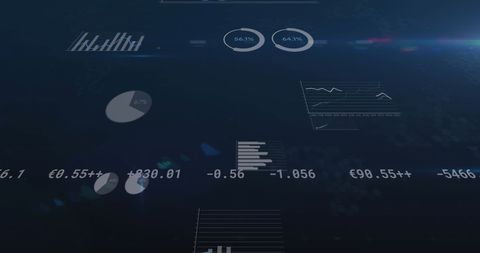
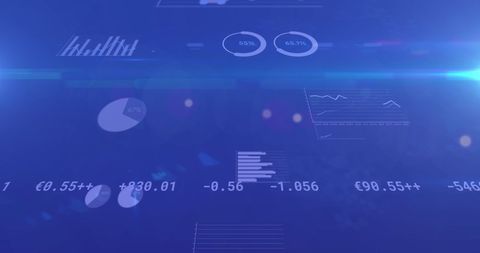
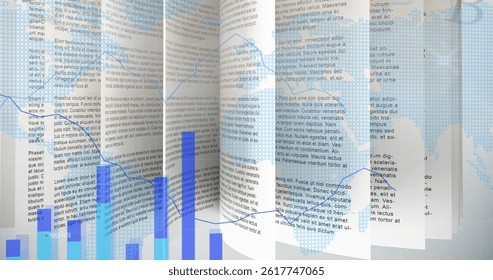
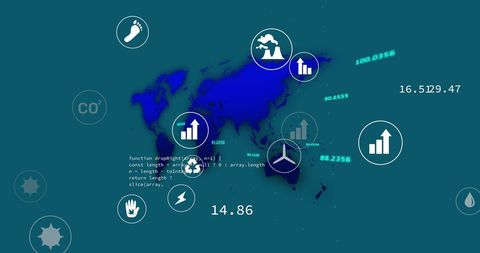
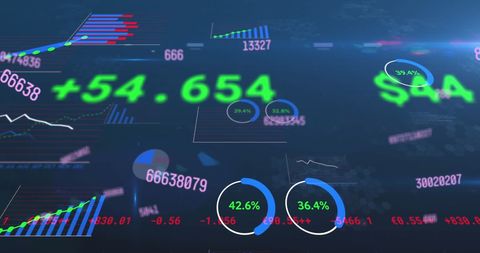
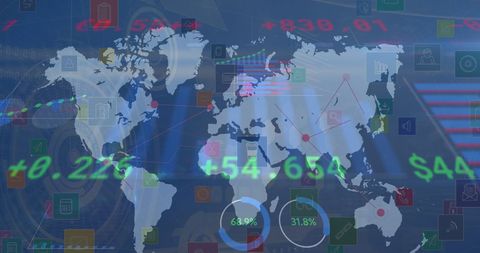
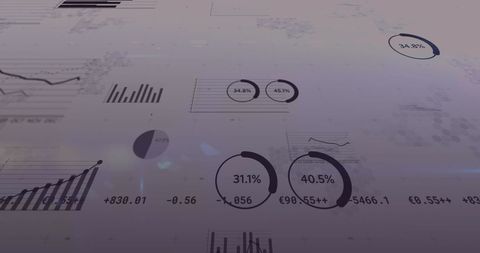
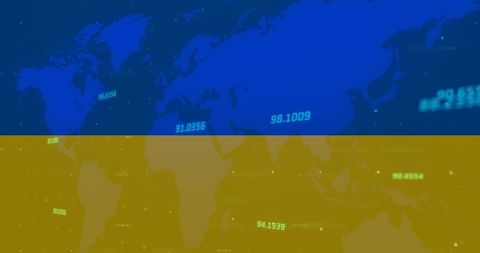
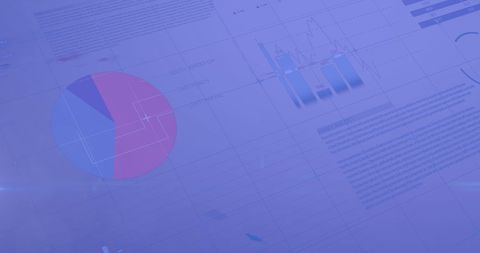
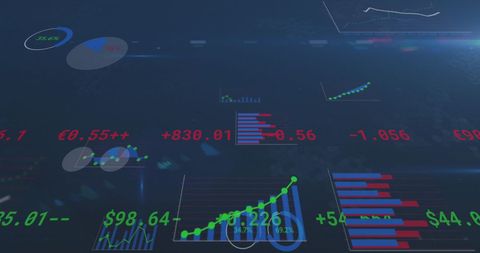
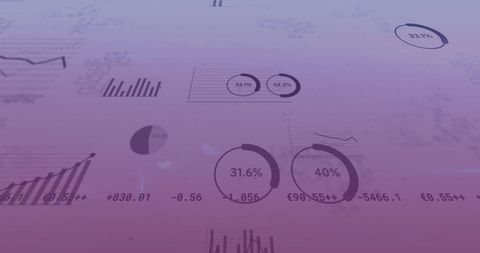
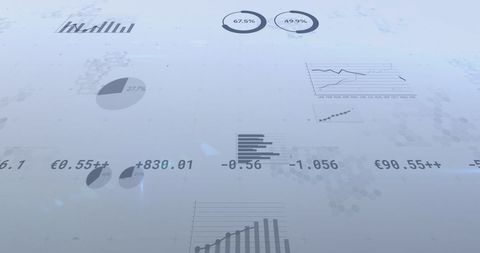
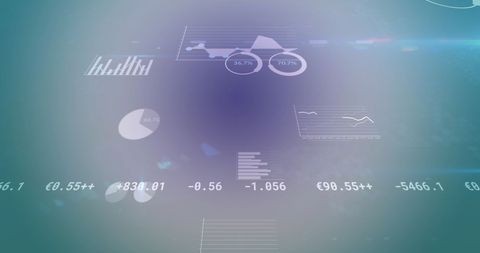
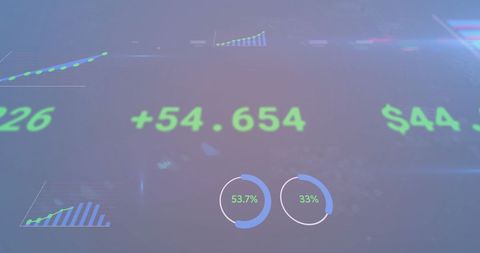
- Financial Data Processing with Digital Charts and Metrics
Financial Data Processing with Digital Charts and Metrics Image
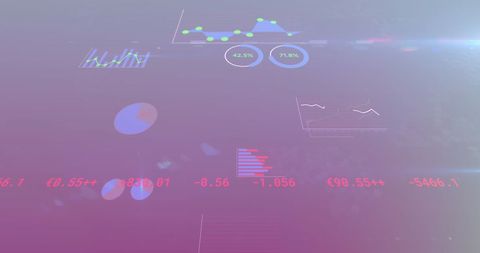
Thlis illustration displays a variety of digital charts and metrics over a dark backdrop, focusing on statistical and financial data analysis. Ideal for business presentations, articles on global finance, or showcasing data technology advancements. Useful in visualizing investments and financial forecasts.
Powered by  - Get 15% off with code: PIKWIZARD15


downloads
Tags:
More
Credit Photo
If you would like to credit the Photo, here are some ways you can do so
Text Link
photo Link
<span class="text-link">
<span>
<a target="_blank" href=https://pikwizard.com/photo/financial-data-processing-with-digital-charts-and-metrics/76dbe00aefbfeb091d30011f0ab20ff0/>PikWizard</a>
</span>
</span>
<span class="image-link">
<span
style="margin: 0 0 20px 0; display: inline-block; vertical-align: middle; width: 100%;"
>
<a
target="_blank"
href="https://pikwizard.com/photo/financial-data-processing-with-digital-charts-and-metrics/76dbe00aefbfeb091d30011f0ab20ff0/"
style="text-decoration: none; font-size: 10px; margin: 0;"
>
<img src="https://pikwizard.com/pw/medium/76dbe00aefbfeb091d30011f0ab20ff0.jpg" style="margin: 0; width: 100%;" alt="" />
<p style="font-size: 12px; margin: 0;">PikWizard</p>
</a>
</span>
</span>
Free (free of charge)
Free for personal and commercial use.
Author: People Creations
Similar Free Stock Images

Premium


Premium

Premium


Premium


Premium


Premium


Premium


Premium
Premium

Premium

Premium


Premium


Premium


Premium


Premium


Premium


Premium


Premium


Premium


Premium


Premium

Premium


Premium


Premium


Premium


Explore More Free Stock Images