
- Home >
- Stock Photos >
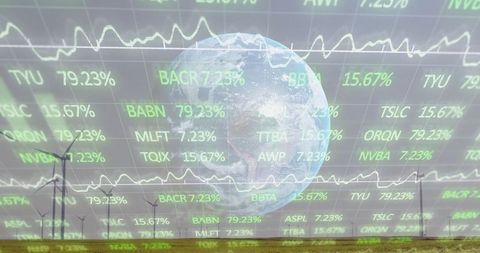
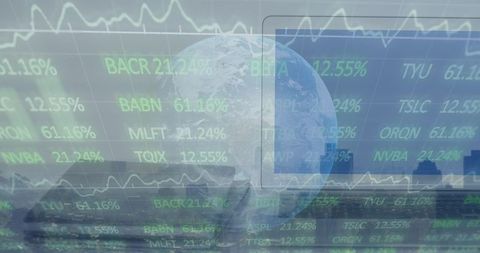
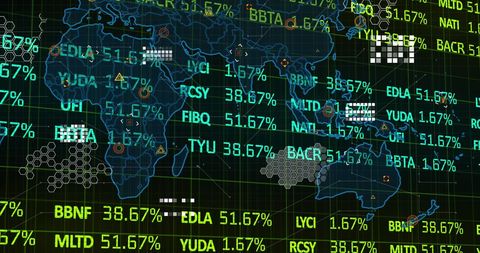
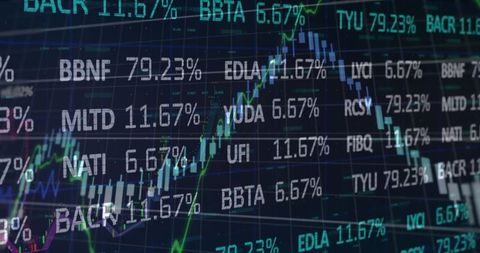
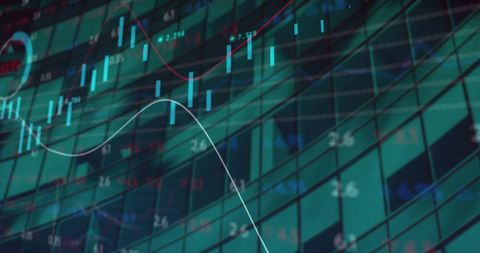
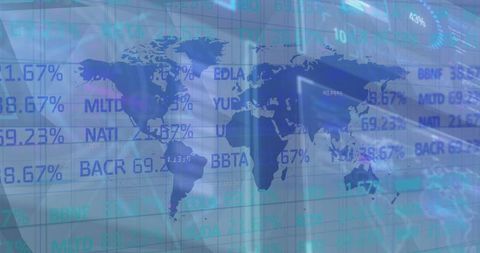
- Financial Data Processing with Digital Graphs and Charts
Financial Data Processing with Digital Graphs and Charts Image
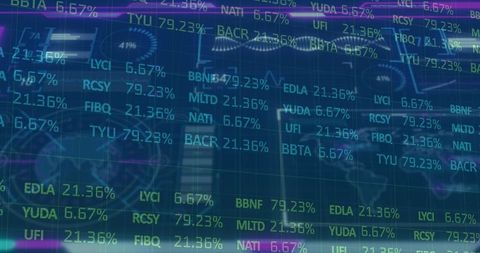
This shows electronic stock data with symbols, numbers, and digital automation elements, providing a look into dynamic financial markets. Useful for projects focusing on financial growth, stock analysis, and the impact of digital transformation in business. Ideal for articles, presentations, or websites dealing with global economic trends or finance technology.
Powered by 


downloads
Tags:
More
Credit Photo
If you would like to credit the Photo, here are some ways you can do so
Text Link
photo Link
<span class="text-link">
<span>
<a target="_blank" href=https://pikwizard.com/photo/financial-data-processing-with-digital-graphs-and-charts/04418544a3958b91ebe5ba7eac7e320d/>PikWizard</a>
</span>
</span>
<span class="image-link">
<span
style="margin: 0 0 20px 0; display: inline-block; vertical-align: middle; width: 100%;"
>
<a
target="_blank"
href="https://pikwizard.com/photo/financial-data-processing-with-digital-graphs-and-charts/04418544a3958b91ebe5ba7eac7e320d/"
style="text-decoration: none; font-size: 10px; margin: 0;"
>
<img src="https://pikwizard.com/pw/medium/04418544a3958b91ebe5ba7eac7e320d.jpg" style="margin: 0; width: 100%;" alt="" />
<p style="font-size: 12px; margin: 0;">PikWizard</p>
</a>
</span>
</span>
Free (free of charge)
Free for personal and commercial use.
Author: Authentic Images
Similar Free Stock Images

Premium


Premium


Premium


Premium

Premium

Premium


Premium


Premium

Premium

Premium


Premium


Premium
Premium


Premium

Premium

Premium


Premium


Premium

Premium


Premium


Premium


Premium

Premium


Premium


Premium

Explore More Free Stock Images