
- Home >
- Stock Photos >
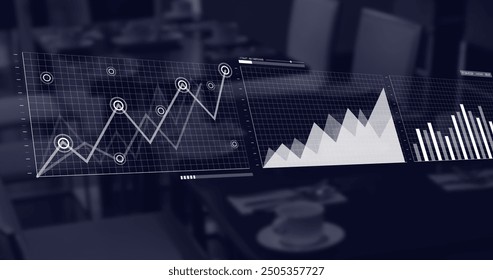
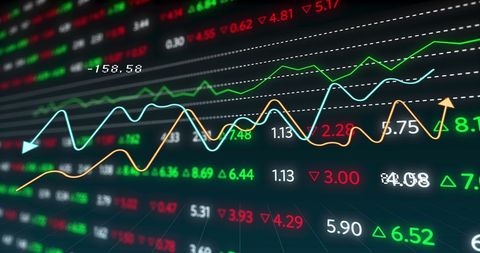
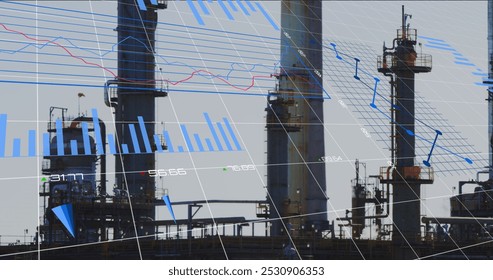
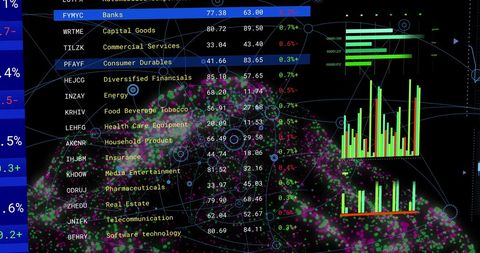
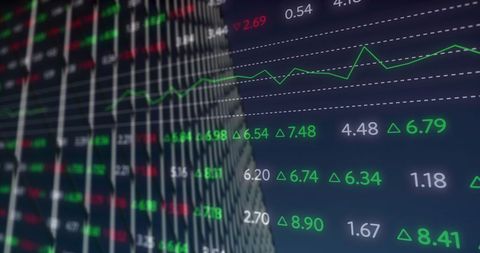
- Financial Data Processing with Digital Graphs and Numbers
Financial Data Processing with Digital Graphs and Numbers Image

Shows digital representation of financial data processing with graphs and numerical values, conveying concepts related to global business and economy. Useful for illustrating economic reports, financial technology articles or business analytics presentations.
Powered by  - Get 15% off with code: PIKWIZARD15


downloads
Tags:
More
Credit Photo
If you would like to credit the Photo, here are some ways you can do so
Text Link
photo Link
<span class="text-link">
<span>
<a target="_blank" href=https://pikwizard.com/photo/financial-data-processing-with-digital-graphs-and-numbers/36137cc73e4ed6cf6ed12f04401aecdf/>PikWizard</a>
</span>
</span>
<span class="image-link">
<span
style="margin: 0 0 20px 0; display: inline-block; vertical-align: middle; width: 100%;"
>
<a
target="_blank"
href="https://pikwizard.com/photo/financial-data-processing-with-digital-graphs-and-numbers/36137cc73e4ed6cf6ed12f04401aecdf/"
style="text-decoration: none; font-size: 10px; margin: 0;"
>
<img src="https://pikwizard.com/pw/medium/36137cc73e4ed6cf6ed12f04401aecdf.jpg" style="margin: 0; width: 100%;" alt="" />
<p style="font-size: 12px; margin: 0;">PikWizard</p>
</a>
</span>
</span>
Free (free of charge)
Free for personal and commercial use.
Author: Authentic Images
Similar Free Stock Images

Premium


Premium

Premium


Premium


Premium


Premium


Premium


Premium


Premium

Premium

Premium


Premium


Premium


Premium


Premium


Premium


Premium


Premium


Premium


Premium


Premium

Premium


Premium


Premium


Premium

Explore More Free Stock Images