- Home >
- Stock Photos >
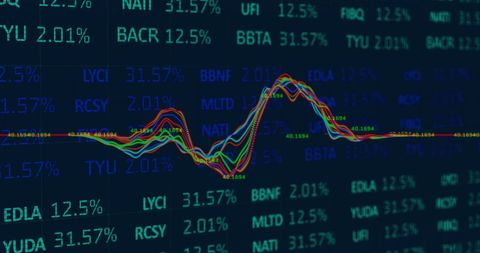
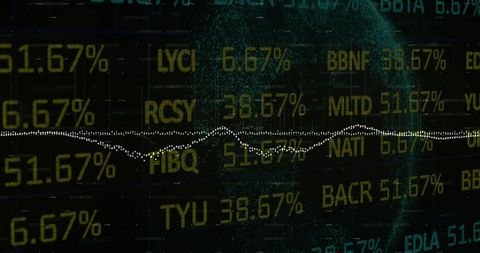
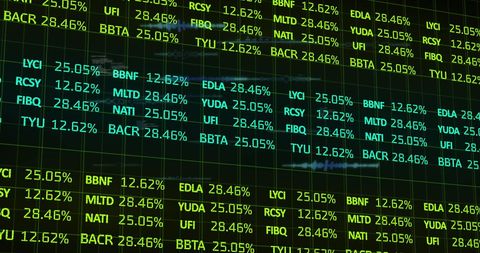
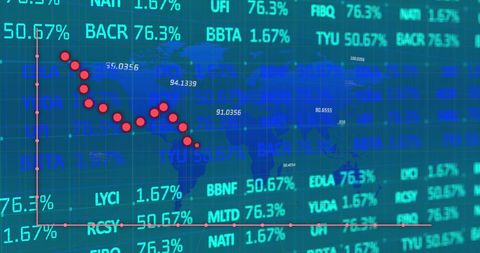
- Financial Data Processing with Digital Interface Design
Financial Data Processing with Digital Interface Design Image

Concept showcasing complex financial data visualizations, highlighting stock market trends and digital interfaces. Useful for presentations, business insights, and financial technology advertisements to illustrate analytics, investments, and global economic trends.

downloads
Tags:
More
Credit Photo
If you would like to credit the Photo, here are some ways you can do so
Text Link
photo Link
<span class="text-link">
<span>
<a target="_blank" href=https://pikwizard.com/photo/financial-data-processing-with-digital-interface-design/02802fa831335d9f04f536540294ba6d/>PikWizard</a>
</span>
</span>
<span class="image-link">
<span
style="margin: 0 0 20px 0; display: inline-block; vertical-align: middle; width: 100%;"
>
<a
target="_blank"
href="https://pikwizard.com/photo/financial-data-processing-with-digital-interface-design/02802fa831335d9f04f536540294ba6d/"
style="text-decoration: none; font-size: 10px; margin: 0;"
>
<img src="https://pikwizard.com/pw/medium/02802fa831335d9f04f536540294ba6d.jpg" style="margin: 0; width: 100%;" alt="" />
<p style="font-size: 12px; margin: 0;">PikWizard</p>
</a>
</span>
</span>
Free (free of charge)
Free for personal and commercial use.
Author: Creative Art