
- Home >
- Stock Photos >
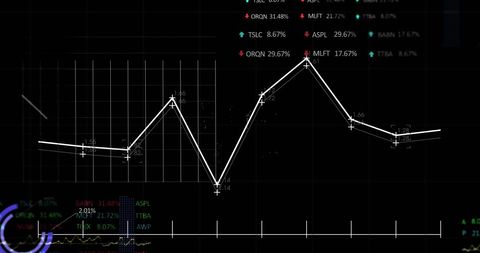
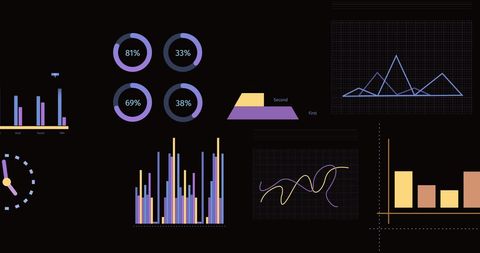
- Financial Data Processing with Dynamic Graphs
Financial Data Processing with Dynamic Graphs Image
Dynamic illustration featuring financial trends and analyses over a black background. Provides a futuristic and technological feel with graphical elements such as lines, charts, and data points. Suitable for use in finance-related presentations, articles on stock market analysis, and resources focused on digital data interpretation. Ideal for web design or background image to illustrate topics associated with financial innovation and data processing systems.
Powered by  - Get 15% off with code: PIKWIZARD15


downloads
Tags:
More
Credit Photo
If you would like to credit the Photo, here are some ways you can do so
Text Link
photo Link
<span class="text-link">
<span>
<a target="_blank" href=https://pikwizard.com/photo/financial-data-processing-with-dynamic-graphs/a7a64833da260432f77cb3707d8dfbc9/>PikWizard</a>
</span>
</span>
<span class="image-link">
<span
style="margin: 0 0 20px 0; display: inline-block; vertical-align: middle; width: 100%;"
>
<a
target="_blank"
href="https://pikwizard.com/photo/financial-data-processing-with-dynamic-graphs/a7a64833da260432f77cb3707d8dfbc9/"
style="text-decoration: none; font-size: 10px; margin: 0;"
>
<img src="https://pikwizard.com/pw/medium/a7a64833da260432f77cb3707d8dfbc9.jpg" style="margin: 0; width: 100%;" alt="" />
<p style="font-size: 12px; margin: 0;">PikWizard</p>
</a>
</span>
</span>
Free (free of charge)
Free for personal and commercial use.
Author: Awesome Content
Similar Free Stock Images

Premium


Premium


Premium


Premium


Premium


Premium


Premium

Premium


Premium


Premium


Premium


Premium


Premium


Premium


Premium


Premium


Premium


Premium


Premium


Premium


Premium


Premium


Premium


Premium


Premium


Explore More Free Stock Images