
- Home >
- Stock Photos >
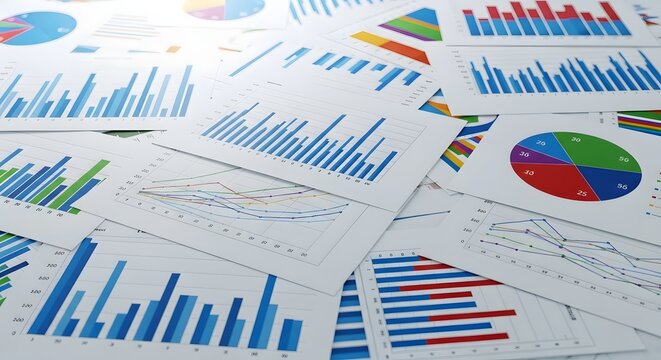
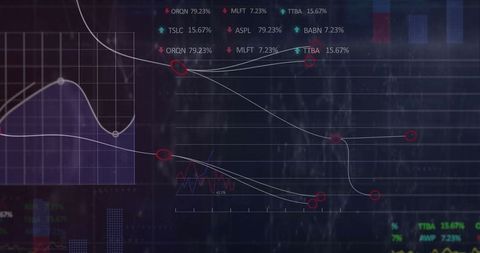
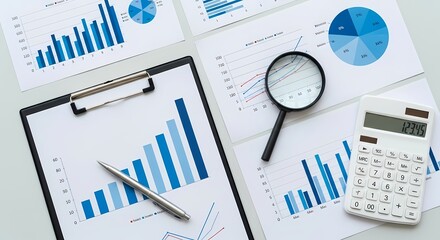
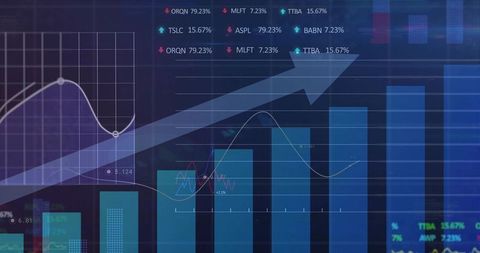
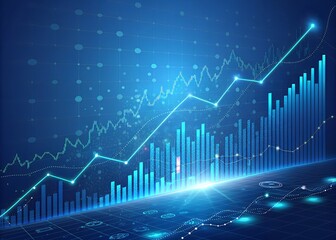
- Financial Data Processing with Graphs and Charts Background
Financial Data Processing with Graphs and Charts Background Image

Digital visualization of financial data and trends on dark background. Useful for articles or projects related to finance, stock market analysis, trading platforms, data analytics, and modern financial technologies. Perfect for presentations or websites focused on economic forecasting and data-driven decision making.
Powered by 


downloads
Tags:
More
Credit Photo
If you would like to credit the Photo, here are some ways you can do so
Text Link
photo Link
<span class="text-link">
<span>
<a target="_blank" href=https://pikwizard.com/photo/financial-data-processing-with-graphs-and-charts-background/b31f8c2e1c2038d461b5c01f50f03f63/>PikWizard</a>
</span>
</span>
<span class="image-link">
<span
style="margin: 0 0 20px 0; display: inline-block; vertical-align: middle; width: 100%;"
>
<a
target="_blank"
href="https://pikwizard.com/photo/financial-data-processing-with-graphs-and-charts-background/b31f8c2e1c2038d461b5c01f50f03f63/"
style="text-decoration: none; font-size: 10px; margin: 0;"
>
<img src="https://pikwizard.com/pw/medium/b31f8c2e1c2038d461b5c01f50f03f63.jpg" style="margin: 0; width: 100%;" alt="" />
<p style="font-size: 12px; margin: 0;">PikWizard</p>
</a>
</span>
</span>
Free (free of charge)
Free for personal and commercial use.
Author: Creative Art
Similar Free Stock Images

Premium


Premium


Premium


Premium


Premium


Premium


Premium

Premium


Premium


Premium


Premium


Premium


Premium


Premium


Premium


Premium


Premium

Premium


Premium

Premium


Premium


Premium


Premium


Premium


Premium


Explore More Free Stock Images