- Home >
- Stock Photos >
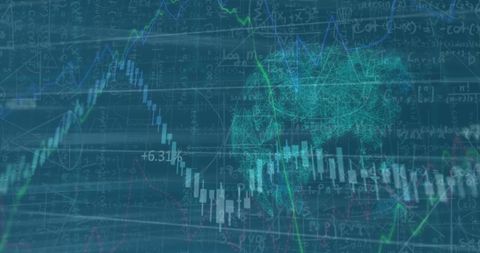
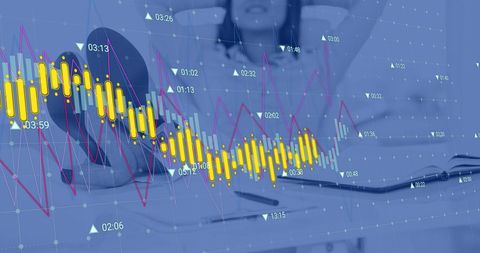
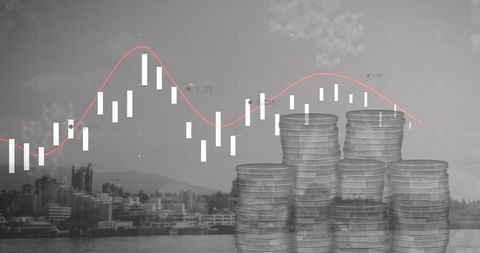
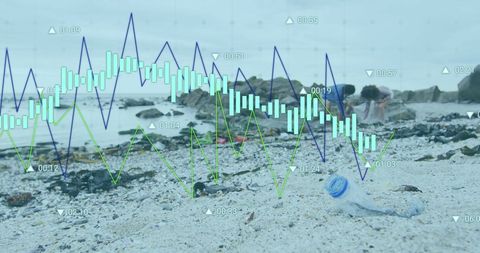
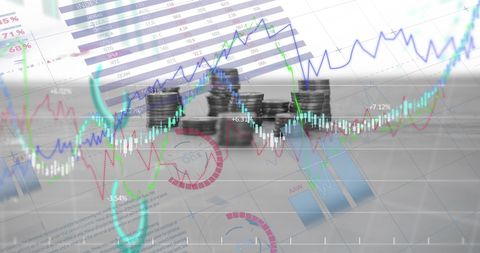
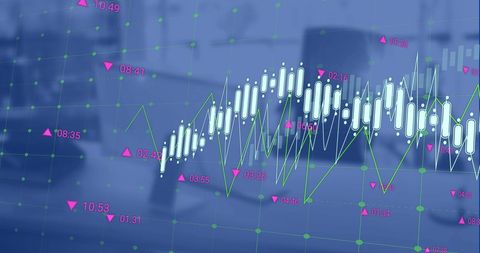
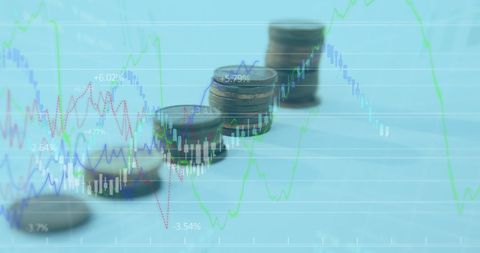
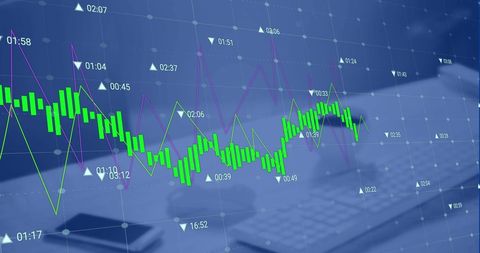
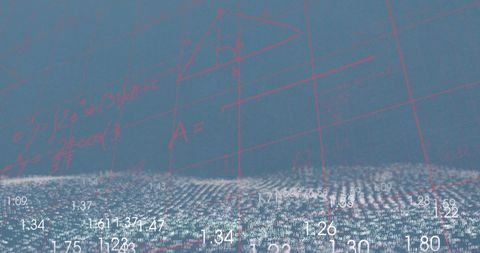
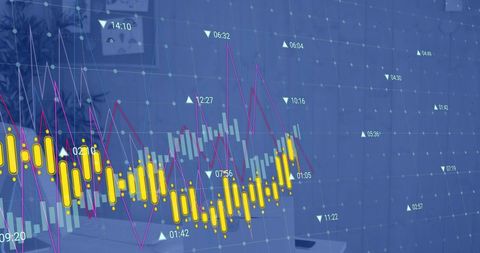
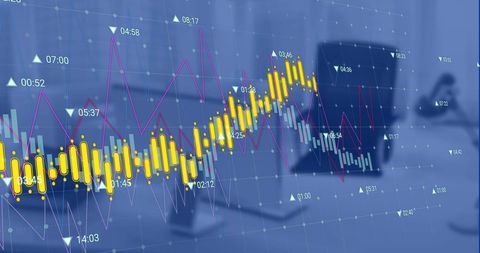
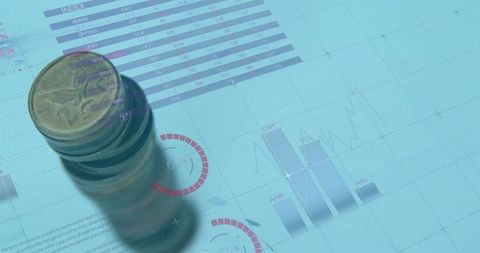
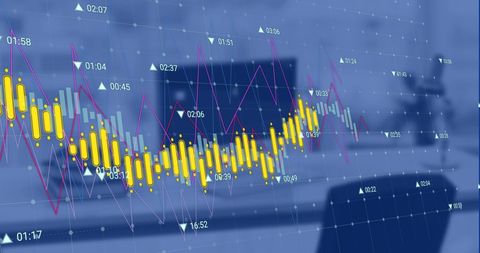
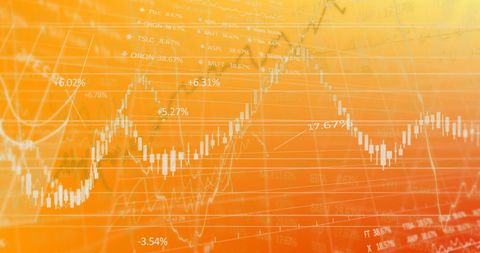
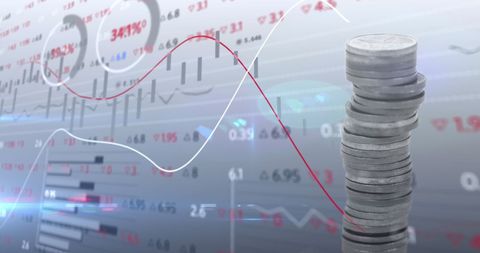
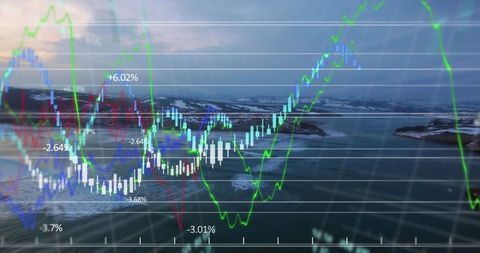
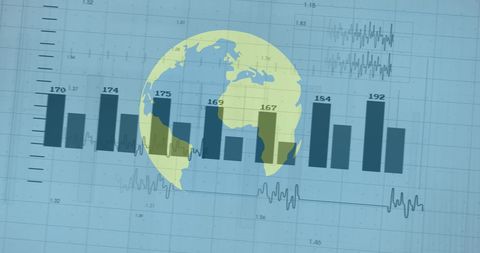
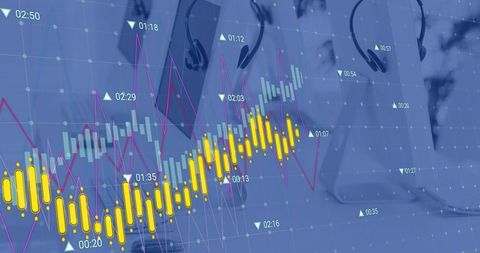
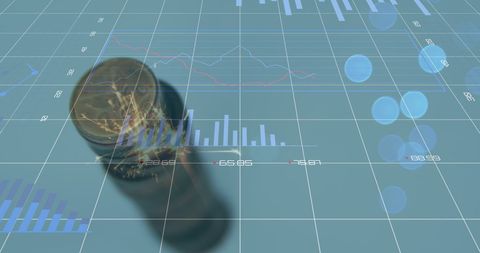
- Financial Data Processing with Graphs and Currency
Financial Data Processing with Graphs and Currency Image
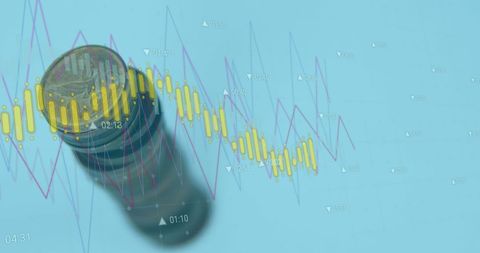
Busy detecting patterns in monetary fluctuation, graphs and currency visualize pushing boundaries in the financial world, ideal for Everything application financial technology illustrations, investment-related content, articles about economics disruption impact societal circumstances rapidly. Distinct representation How managing way deal channels various directions sticking towards full potential going forward.

downloads
Tags:
More
Credit Photo
If you would like to credit the Photo, here are some ways you can do so
Text Link
photo Link
<span class="text-link">
<span>
<a target="_blank" href=https://pikwizard.com/photo/financial-data-processing-with-graphs-and-currency/444156250a4dbc5079df1274b1596852/>PikWizard</a>
</span>
</span>
<span class="image-link">
<span
style="margin: 0 0 20px 0; display: inline-block; vertical-align: middle; width: 100%;"
>
<a
target="_blank"
href="https://pikwizard.com/photo/financial-data-processing-with-graphs-and-currency/444156250a4dbc5079df1274b1596852/"
style="text-decoration: none; font-size: 10px; margin: 0;"
>
<img src="https://pikwizard.com/pw/medium/444156250a4dbc5079df1274b1596852.jpg" style="margin: 0; width: 100%;" alt="" />
<p style="font-size: 12px; margin: 0;">PikWizard</p>
</a>
</span>
</span>
Free (free of charge)
Free for personal and commercial use.
Author: Awesome Content