
- Home >
- Stock Photos >
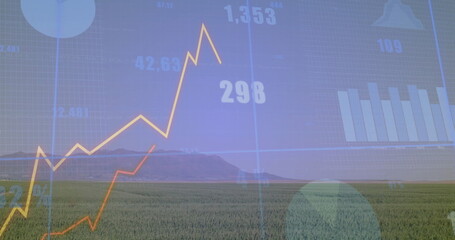
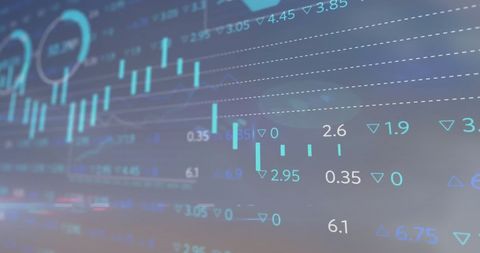
- Financial Data Processing with Graphs and Numbers
Financial Data Processing with Graphs and Numbers Image

Dynamic illustration featuring digital displays of graphs and numerical data signifies concepts of global finance and business analytics. Perfect for use in presentations about economic trends, investment strategies, stock market analyses, and technological advancements in data processing.
Powered by 


downloads
Tags:
More
Credit Photo
If you would like to credit the Photo, here are some ways you can do so
Text Link
photo Link
<span class="text-link">
<span>
<a target="_blank" href=https://pikwizard.com/photo/financial-data-processing-with-graphs-and-numbers/691e11e9680040c4f30183d9b296d540/>PikWizard</a>
</span>
</span>
<span class="image-link">
<span
style="margin: 0 0 20px 0; display: inline-block; vertical-align: middle; width: 100%;"
>
<a
target="_blank"
href="https://pikwizard.com/photo/financial-data-processing-with-graphs-and-numbers/691e11e9680040c4f30183d9b296d540/"
style="text-decoration: none; font-size: 10px; margin: 0;"
>
<img src="https://pikwizard.com/pw/medium/691e11e9680040c4f30183d9b296d540.jpg" style="margin: 0; width: 100%;" alt="" />
<p style="font-size: 12px; margin: 0;">PikWizard</p>
</a>
</span>
</span>
Free (free of charge)
Free for personal and commercial use.
Author: Authentic Images
Similar Free Stock Images

Premium


Premium

Premium


Premium


Premium


Premium


Premium

Premium


Premium


Premium


Premium


Premium


Premium


Premium


Premium


Premium


Premium


Premium


Premium


Premium

Premium


Premium


Premium


Premium


Premium


Explore More Free Stock Images