- Home >
- Stock Photos >
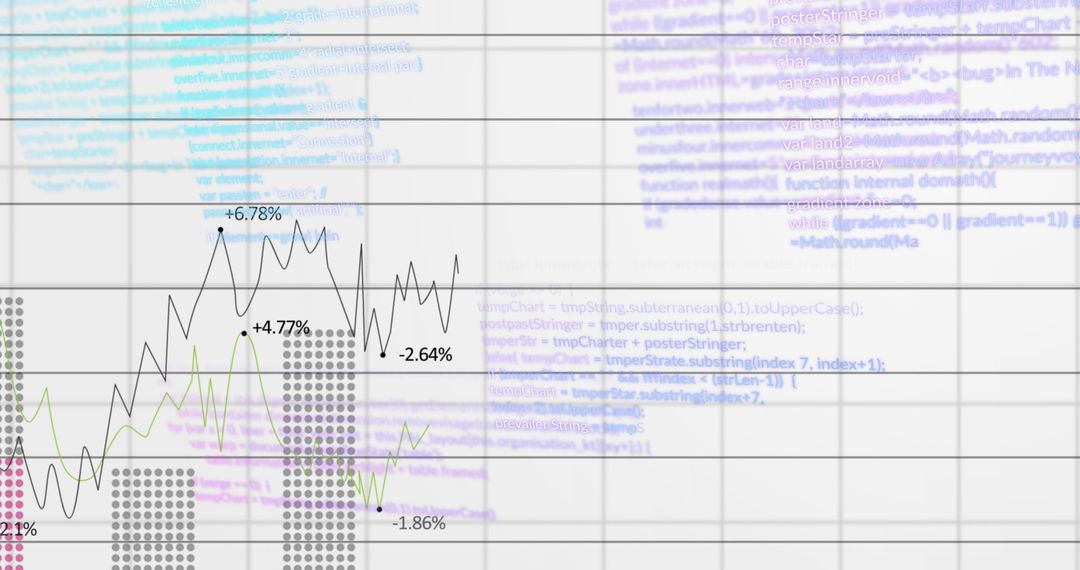
- Financial Data Processing with Graphs and Trends on White Background
Financial Data Processing with Graphs and Trends on White Background Image

This visual showcases graphs and data analytics, illustrating financial trend analysis with red and blue lines. Suitable for presentations or content relating to financial analytics, technology, economic forecasting, or the study of trends. Effective for educational materials, business reports, and articles concerning financial sciences or data processing technology.
Powered by  - Get 15% off with code: PIKWIZARD15


2
downloads
downloads
Tags:
More
Credit Photo
If you would like to credit the Photo, here are some ways you can do so
Text Link
photo Link
<span class="text-link">
<span>
<a target="_blank" href=https://pikwizard.com/photo/financial-data-processing-with-graphs-and-trends-on-white-background/1bc5d06a25c21af449ed73e61ce667d9/>PikWizard</a>
</span>
</span>
<span class="image-link">
<span
style="margin: 0 0 20px 0; display: inline-block; vertical-align: middle; width: 100%;"
>
<a
target="_blank"
href="https://pikwizard.com/photo/financial-data-processing-with-graphs-and-trends-on-white-background/1bc5d06a25c21af449ed73e61ce667d9/"
style="text-decoration: none; font-size: 10px; margin: 0;"
>
<img src="https://pikwizard.com/pw/medium/1bc5d06a25c21af449ed73e61ce667d9.jpg" style="margin: 0; width: 100%;" alt="" />
<p style="font-size: 12px; margin: 0;">PikWizard</p>
</a>
</span>
</span>
Free (free of charge)
Free for personal and commercial use.
Author: People Creations
Similar Free Stock Images

Premium


Premium


Premium


Premium


Premium


Premium


Premium


Premium


Premium


Premium


Premium


Premium


Premium


Premium


Premium


Premium


Premium


Premium


Premium


Premium


Premium


Premium


Premium


Premium