
- Home >
- Stock Photos >
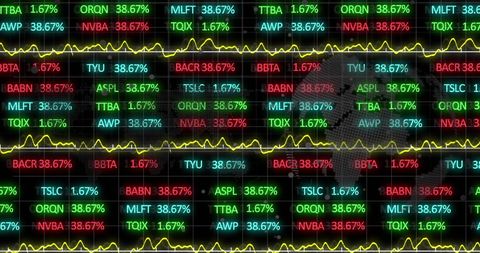
- Financial Data Processing with Graphs and White Envelope overlay
Financial Data Processing with Graphs and White Envelope overlay Image

Features a digital interface showcasing financial and stock market data with various numbers and graphs. Central subject includes digital representations layered with a white envelope symbolizing secure and vital communication in finance sectors. Useful for conveying themes of investment analysis, economic strategy, or global market trends for articles or brochures in the finance industry.
Powered by 


downloads
Tags:
More
Credit Photo
If you would like to credit the Photo, here are some ways you can do so
Text Link
photo Link
<span class="text-link">
<span>
<a target="_blank" href=https://pikwizard.com/photo/financial-data-processing-with-graphs-and-white-envelope-overlay/f4e96f58be5329be967c3c136073c243/>PikWizard</a>
</span>
</span>
<span class="image-link">
<span
style="margin: 0 0 20px 0; display: inline-block; vertical-align: middle; width: 100%;"
>
<a
target="_blank"
href="https://pikwizard.com/photo/financial-data-processing-with-graphs-and-white-envelope-overlay/f4e96f58be5329be967c3c136073c243/"
style="text-decoration: none; font-size: 10px; margin: 0;"
>
<img src="https://pikwizard.com/pw/medium/f4e96f58be5329be967c3c136073c243.jpg" style="margin: 0; width: 100%;" alt="" />
<p style="font-size: 12px; margin: 0;">PikWizard</p>
</a>
</span>
</span>
Free (free of charge)
Free for personal and commercial use.
Author: Creative Art
Similar Free Stock Images

Premium


Premium

Premium


Premium


Premium


Premium

Premium


Premium


Premium

Premium

Premium


Premium


Premium


Premium


Premium


Premium

Premium

Premium


Premium

Premium


Premium

Premium


Premium


Premium


Premium

Explore More Free Stock Images