- Home >
- Stock Photos >
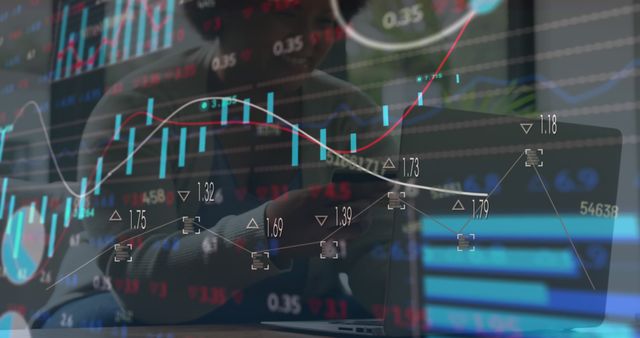
- Financial Data Processing with Graphs Overlay
Financial Data Processing with Graphs Overlay Image
The digital overlay of financial graphs on numeric data suggests contemporary economic analysis. Useful for depicting themes related to business growth, data analysis, and financial technology. Ideal for articles, presentations, or websites centered around financial trends, global markets, or analytic software developments.

downloads
Tags:
More
Credit Photo
If you would like to credit the Photo, here are some ways you can do so
Text Link
photo Link
<span class="text-link">
<span>
<a target="_blank" href=https://pikwizard.com/photo/financial-data-processing-with-graphs-overlay/bfd5683c1fcddc9985fc63d5beec2723/>PikWizard</a>
</span>
</span>
<span class="image-link">
<span
style="margin: 0 0 20px 0; display: inline-block; vertical-align: middle; width: 100%;"
>
<a
target="_blank"
href="https://pikwizard.com/photo/financial-data-processing-with-graphs-overlay/bfd5683c1fcddc9985fc63d5beec2723/"
style="text-decoration: none; font-size: 10px; margin: 0;"
>
<img src="https://pikwizard.com/pw/medium/bfd5683c1fcddc9985fc63d5beec2723.jpg" style="margin: 0; width: 100%;" alt="" />
<p style="font-size: 12px; margin: 0;">PikWizard</p>
</a>
</span>
</span>
Free (free of charge)
Free for personal and commercial use.
Author: Awesome Content