- Home >
- Stock Photos >
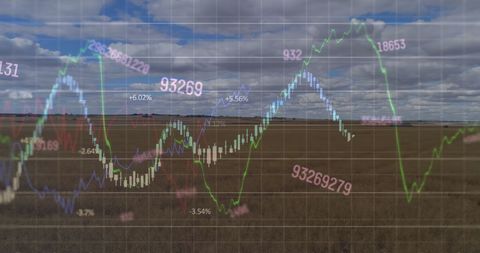
- Financial Data Processing with Mathematical Formulae Interface
Financial Data Processing with Mathematical Formulae Interface Image

This image shows complex financial data being processed alongside mathematical formulae on a digital interface. Perfect for illustrating concepts of global finance, stock market exchanges, and economic analysis, this image is ideal for financial reports, analytic presentations, or educating audiences about data visualization techniques.

downloads
Tags:
More
Credit Photo
If you would like to credit the Photo, here are some ways you can do so
Text Link
photo Link
<span class="text-link">
<span>
<a target="_blank" href=https://pikwizard.com/photo/financial-data-processing-with-mathematical-formulae-interface/e060ae916c58e93b891aeb0cf37f070f/>PikWizard</a>
</span>
</span>
<span class="image-link">
<span
style="margin: 0 0 20px 0; display: inline-block; vertical-align: middle; width: 100%;"
>
<a
target="_blank"
href="https://pikwizard.com/photo/financial-data-processing-with-mathematical-formulae-interface/e060ae916c58e93b891aeb0cf37f070f/"
style="text-decoration: none; font-size: 10px; margin: 0;"
>
<img src="https://pikwizard.com/pw/medium/e060ae916c58e93b891aeb0cf37f070f.jpg" style="margin: 0; width: 100%;" alt="" />
<p style="font-size: 12px; margin: 0;">PikWizard</p>
</a>
</span>
</span>
Free (free of charge)
Free for personal and commercial use.
Author: People Creations