- Home >
- Stock Photos >
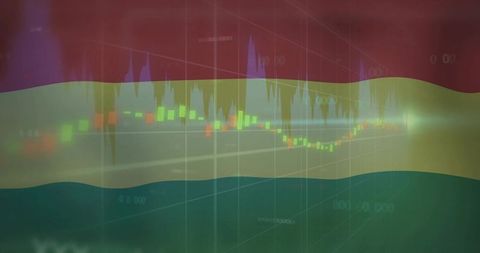
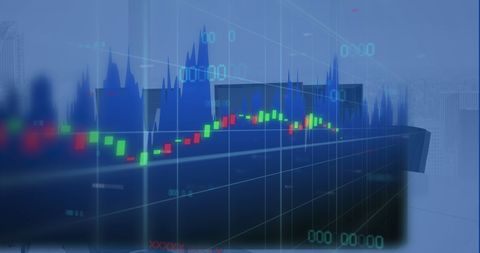
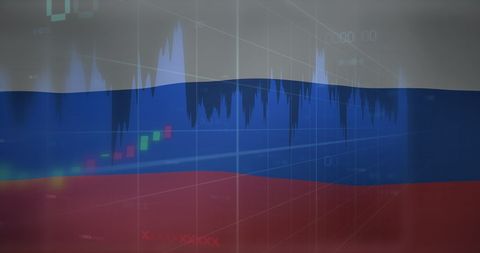
- Financial Data Processing with Molecular Overlay in a Digital Interface
Financial Data Processing with Molecular Overlay in a Digital Interface Image

Futuristic depiction of financial data processing merging with digital molecule depictions suggest interplay between finance and scientific research. Great for highlighting intersections between economic systems and technological innovations. Suitable for content emphasizing global finance technology, economic sciences, and digital advancement.

downloads
Tags:
More
Credit Photo
If you would like to credit the Photo, here are some ways you can do so
Text Link
photo Link
<span class="text-link">
<span>
<a target="_blank" href=https://pikwizard.com/photo/financial-data-processing-with-molecular-overlay-in-a-digital-interface/cd6b1663bfd03b13b5a2b0150a3a7417/>PikWizard</a>
</span>
</span>
<span class="image-link">
<span
style="margin: 0 0 20px 0; display: inline-block; vertical-align: middle; width: 100%;"
>
<a
target="_blank"
href="https://pikwizard.com/photo/financial-data-processing-with-molecular-overlay-in-a-digital-interface/cd6b1663bfd03b13b5a2b0150a3a7417/"
style="text-decoration: none; font-size: 10px; margin: 0;"
>
<img src="https://pikwizard.com/pw/medium/cd6b1663bfd03b13b5a2b0150a3a7417.jpg" style="margin: 0; width: 100%;" alt="" />
<p style="font-size: 12px; margin: 0;">PikWizard</p>
</a>
</span>
</span>
Free (free of charge)
Free for personal and commercial use.
Author: Creative Art