
- Home >
- Stock Photos >
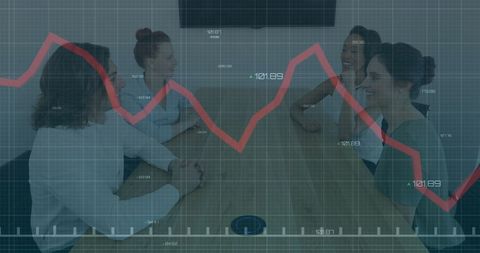
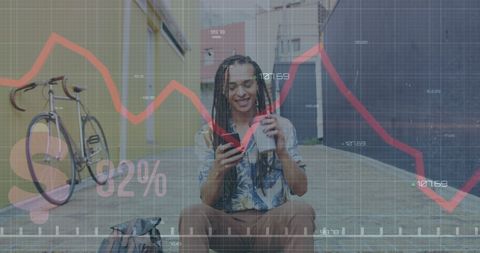
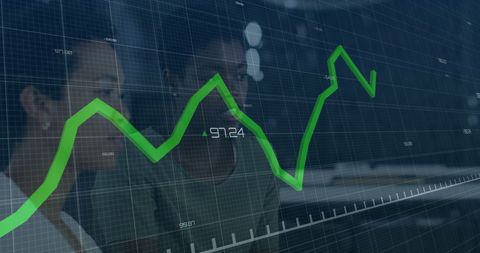
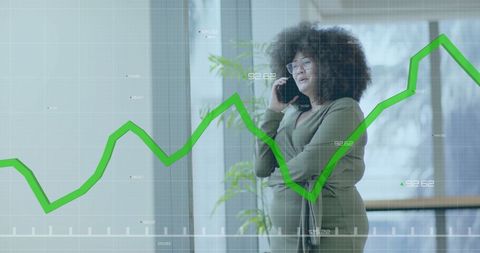
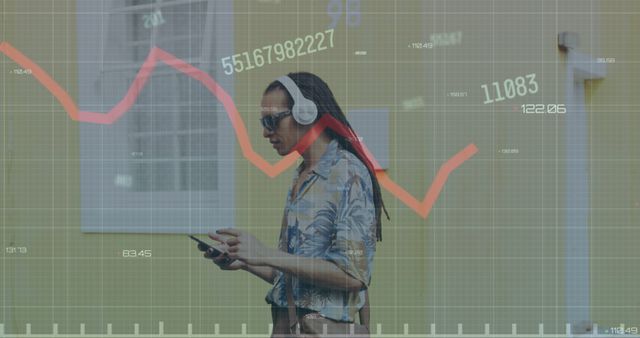
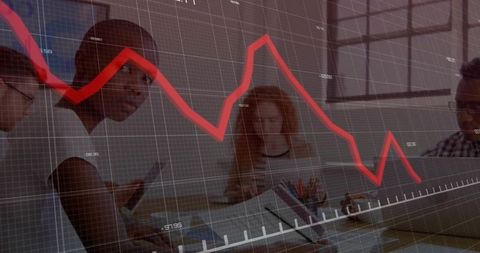
- Financial Data Processing with Woman Using Smartphone
Financial Data Processing with Woman Using Smartphone Image

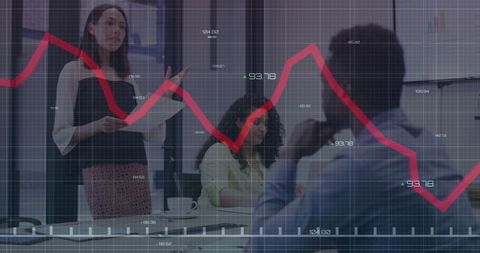
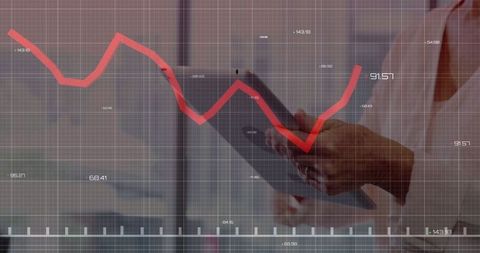
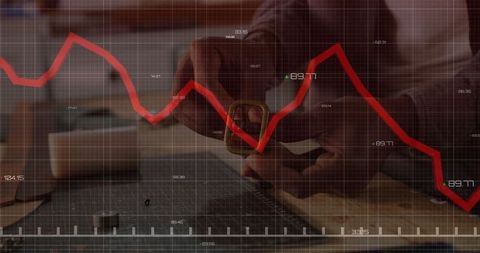
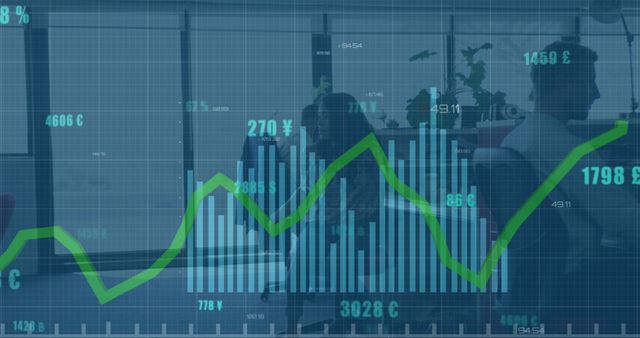
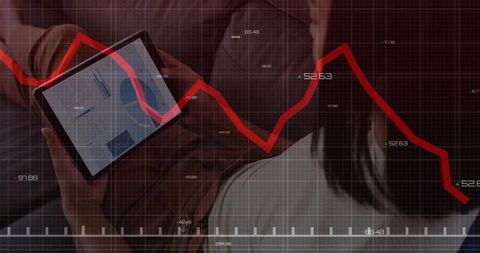
Young woman holds smartphone, communicating while surrounded by graph of financial statistics. Ideal for illustrating data analysis, technology communication, or stock market insights in business presentations and digital platform marketing materials.
Powered by  - Get 15% off with code: PIKWIZARD15


downloads
Tags:
More
Credit Photo
If you would like to credit the Photo, here are some ways you can do so
Text Link
photo Link
<span class="text-link">
<span>
<a target="_blank" href=https://pikwizard.com/photo/financial-data-processing-with-woman-using-smartphone/b7a1b56e79c702d3f6ff9904d73f5f8a/>PikWizard</a>
</span>
</span>
<span class="image-link">
<span
style="margin: 0 0 20px 0; display: inline-block; vertical-align: middle; width: 100%;"
>
<a
target="_blank"
href="https://pikwizard.com/photo/financial-data-processing-with-woman-using-smartphone/b7a1b56e79c702d3f6ff9904d73f5f8a/"
style="text-decoration: none; font-size: 10px; margin: 0;"
>
<img src="https://pikwizard.com/pw/medium/b7a1b56e79c702d3f6ff9904d73f5f8a.jpg" style="margin: 0; width: 100%;" alt="" />
<p style="font-size: 12px; margin: 0;">PikWizard</p>
</a>
</span>
</span>
Free (free of charge)
Free for personal and commercial use.
Author: Authentic Images
Similar Free Stock Images

Premium


Premium

Premium


Premium


Premium

Premium


Premium


Premium


Premium


Premium


Premium


Premium


Premium


Premium


Premium

Premium


Premium


Premium


Premium


Premium


Premium


Premium


Premium


Premium


Premium


Explore More Free Stock Images