
- Home >
- Stock Photos >
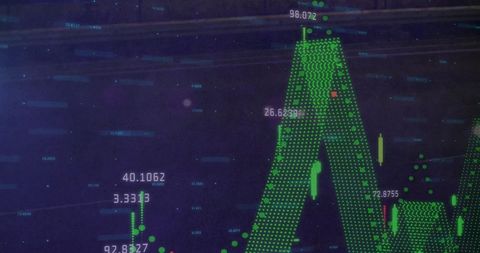
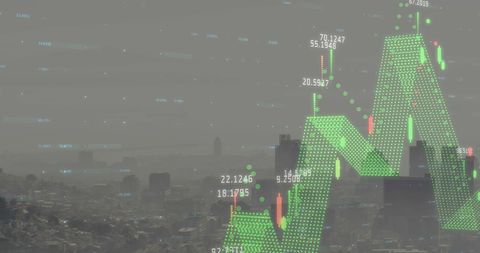
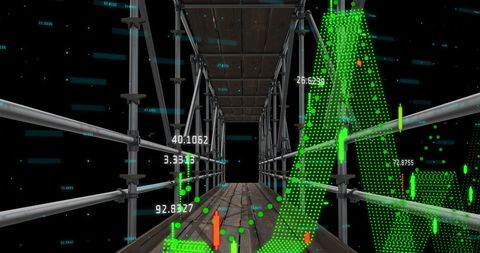
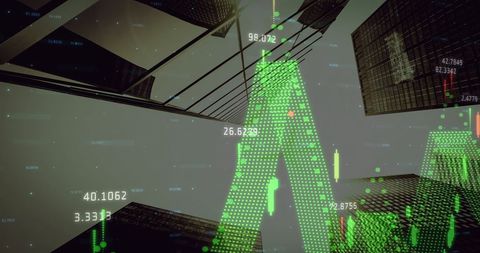
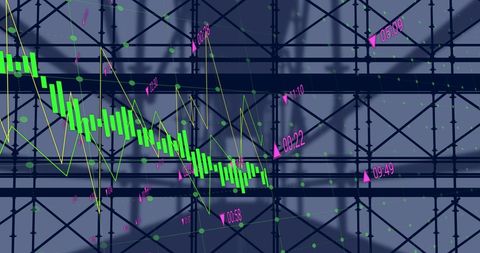
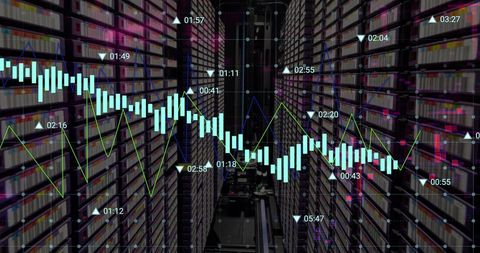
- Financial Data Projection on Scaffolding Structure
Financial Data Projection on Scaffolding Structure Image
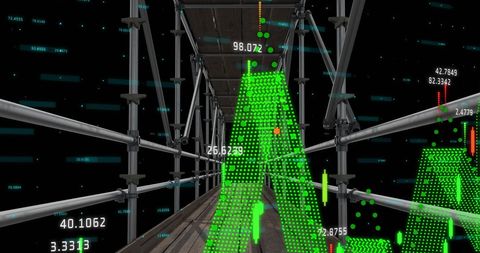
Virtual financial graphs and numbers overlay a scaffolding structure, symbolizing the intersection of construction industry and global digital economy. Ideal for use in fintech presentations, business analysis, or as a visual effect for content related to stock markets and financial forecasting.
Powered by 


downloads
Tags:
More
Credit Photo
If you would like to credit the Photo, here are some ways you can do so
Text Link
photo Link
<span class="text-link">
<span>
<a target="_blank" href=https://pikwizard.com/photo/financial-data-projection-on-scaffolding-structure/cfd4f2ecb54d312b15923c229889fcb1/>PikWizard</a>
</span>
</span>
<span class="image-link">
<span
style="margin: 0 0 20px 0; display: inline-block; vertical-align: middle; width: 100%;"
>
<a
target="_blank"
href="https://pikwizard.com/photo/financial-data-projection-on-scaffolding-structure/cfd4f2ecb54d312b15923c229889fcb1/"
style="text-decoration: none; font-size: 10px; margin: 0;"
>
<img src="https://pikwizard.com/pw/medium/cfd4f2ecb54d312b15923c229889fcb1.jpg" style="margin: 0; width: 100%;" alt="" />
<p style="font-size: 12px; margin: 0;">PikWizard</p>
</a>
</span>
</span>
Free (free of charge)
Free for personal and commercial use.
Author: Awesome Content
Similar Free Stock Images

Premium


Premium

Premium


Premium


Premium


Premium


Premium


Premium


Premium

Premium


Premium

Premium


Premium


Premium


Premium

Premium

Premium


Premium


Premium


Premium


Premium


Premium


Premium


Premium


Premium


Explore More Free Stock Images