
- Home >
- Stock Photos >
- Financial Data Projection Over Junkyard Metaphor of Volatility
Financial Data Projection Over Junkyard Metaphor of Volatility Image
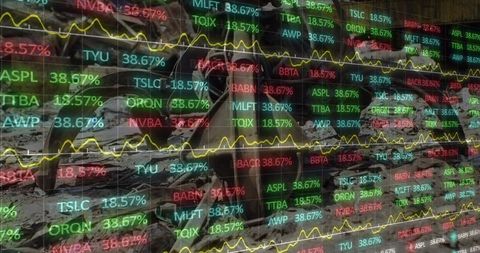
Scene combines imagery of financial data projections over a junkyard, signifying volatility and potential risks. Green and red lines represent market changes, suggesting economic instability. Useful for illustrating global market uncertainty, financial forecasting, or data-driven decision challenges.
Powered by 


2
downloads
downloads
Tags:
More
Credit Photo
If you would like to credit the Photo, here are some ways you can do so
Text Link
photo Link
<span class="text-link">
<span>
<a target="_blank" href=https://pikwizard.com/photo/financial-data-projection-over-junkyard-metaphor-of-volatility/b77ebf83c8f5ccadd48bc1d995504946/>PikWizard</a>
</span>
</span>
<span class="image-link">
<span
style="margin: 0 0 20px 0; display: inline-block; vertical-align: middle; width: 100%;"
>
<a
target="_blank"
href="https://pikwizard.com/photo/financial-data-projection-over-junkyard-metaphor-of-volatility/b77ebf83c8f5ccadd48bc1d995504946/"
style="text-decoration: none; font-size: 10px; margin: 0;"
>
<img src="https://pikwizard.com/pw/medium/b77ebf83c8f5ccadd48bc1d995504946.jpg" style="margin: 0; width: 100%;" alt="" />
<p style="font-size: 12px; margin: 0;">PikWizard</p>
</a>
</span>
</span>
Free (free of charge)
Free for personal and commercial use.
Author: People Creations