- Home >
- Stock Photos >
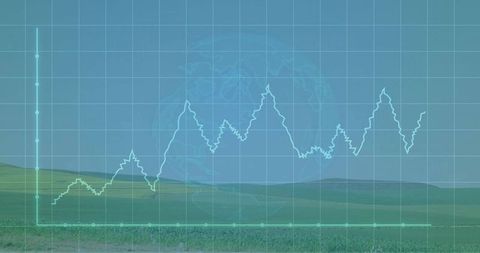
- Financial Data Statistics Visualized in Urban Setting
Financial Data Statistics Visualized in Urban Setting Image

Visualization depicts upward and downward trends in financial data against an urban cityscape backdrop. Use for illustrating business analysis, market trends, or educational materials related to finance and economics.

downloads
Tags:
More
Credit Photo
If you would like to credit the Photo, here are some ways you can do so
Text Link
photo Link
<span class="text-link">
<span>
<a target="_blank" href=https://pikwizard.com/photo/financial-data-statistics-visualized-in-urban-setting/f55cb94cc0b187a558a0058dad61eb11/>PikWizard</a>
</span>
</span>
<span class="image-link">
<span
style="margin: 0 0 20px 0; display: inline-block; vertical-align: middle; width: 100%;"
>
<a
target="_blank"
href="https://pikwizard.com/photo/financial-data-statistics-visualized-in-urban-setting/f55cb94cc0b187a558a0058dad61eb11/"
style="text-decoration: none; font-size: 10px; margin: 0;"
>
<img src="https://pikwizard.com/pw/medium/f55cb94cc0b187a558a0058dad61eb11.jpg" style="margin: 0; width: 100%;" alt="" />
<p style="font-size: 12px; margin: 0;">PikWizard</p>
</a>
</span>
</span>
Free (free of charge)
Free for personal and commercial use.
Author: People Creations