
- Home >
- Stock Photos >
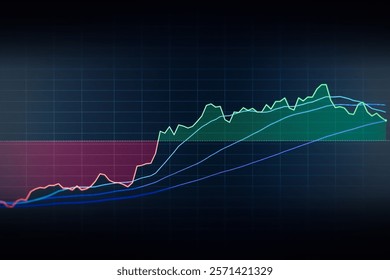
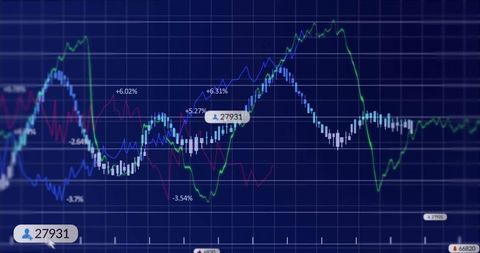
- Financial Data Stock Analysis with Code Overlays
Financial Data Stock Analysis with Code Overlays Image

Dynamic visual of financial data and stock market analysis interwoven with snippets of computer code on dark grid backdrop, symbolizing the intersection of finance and technology. This is ideal for illustrating concepts in fintech, data-driven investment strategies, programming in finance, and economic digital innovation. It is well suited for websites, blogs, presentations, and educational materials focusing on technological advancements in financial industries.
Powered by  - Get 15% off with code: PIKWIZARD15


downloads
Tags:
More
Credit Photo
If you would like to credit the Photo, here are some ways you can do so
Text Link
photo Link
<span class="text-link">
<span>
<a target="_blank" href=https://pikwizard.com/photo/financial-data-stock-analysis-with-code-overlays/1d2e967d1dfa49c993536e480f2e95b6/>PikWizard</a>
</span>
</span>
<span class="image-link">
<span
style="margin: 0 0 20px 0; display: inline-block; vertical-align: middle; width: 100%;"
>
<a
target="_blank"
href="https://pikwizard.com/photo/financial-data-stock-analysis-with-code-overlays/1d2e967d1dfa49c993536e480f2e95b6/"
style="text-decoration: none; font-size: 10px; margin: 0;"
>
<img src="https://pikwizard.com/pw/medium/1d2e967d1dfa49c993536e480f2e95b6.jpg" style="margin: 0; width: 100%;" alt="" />
<p style="font-size: 12px; margin: 0;">PikWizard</p>
</a>
</span>
</span>
Free (free of charge)
Free for personal and commercial use.
Author: People Creations
Similar Free Stock Images

Premium


Premium


Premium


Premium


Premium


Premium


Premium


Premium


Premium


Premium


Premium


Premium

Premium

Premium


Premium

Premium


Premium
Premium


Premium


Premium


Premium


Premium

Premium

AI


Premium

Premium

Explore More Free Stock Images