- Home >
- Stock Photos >
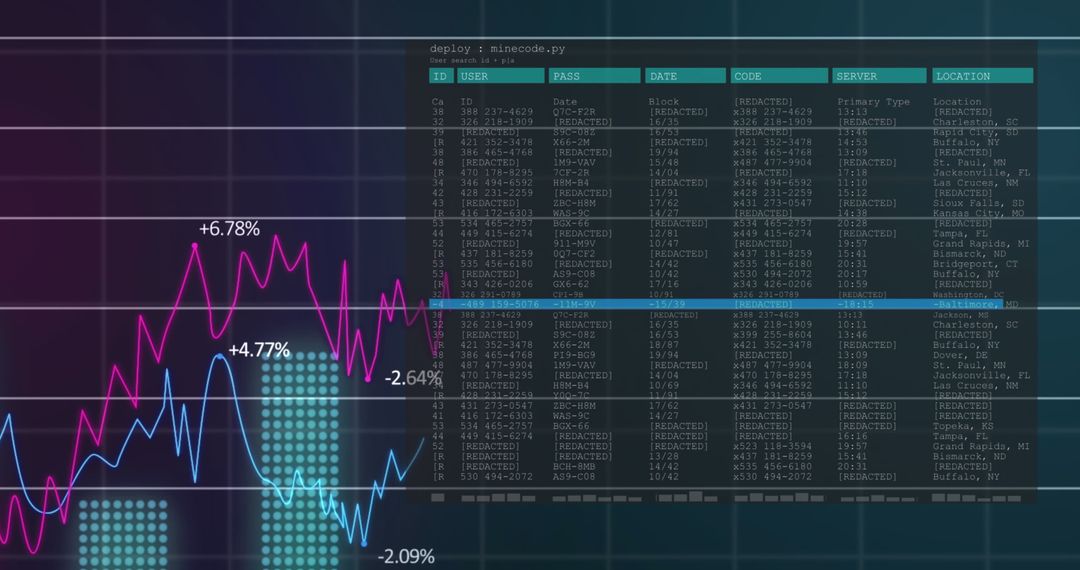
- Financial Data Streaming with Arrows Over Graphic Indicators
Financial Data Streaming with Arrows Over Graphic Indicators Image

Depicts dynamic digital illustration conveying complex financial data analysis. Suitable for financial technology visuals, business reports, investment strategy presentations, or educational content on trading and economics.
Powered by 


2
downloads
downloads
Tags:
More
Credit Photo
If you would like to credit the Photo, here are some ways you can do so
Text Link
photo Link
<span class="text-link">
<span>
<a target="_blank" href=https://pikwizard.com/photo/financial-data-streaming-with-arrows-over-graphic-indicators/d5a152bcc969657fb8466ac58f7a8489/>PikWizard</a>
</span>
</span>
<span class="image-link">
<span
style="margin: 0 0 20px 0; display: inline-block; vertical-align: middle; width: 100%;"
>
<a
target="_blank"
href="https://pikwizard.com/photo/financial-data-streaming-with-arrows-over-graphic-indicators/d5a152bcc969657fb8466ac58f7a8489/"
style="text-decoration: none; font-size: 10px; margin: 0;"
>
<img src="https://pikwizard.com/pw/medium/d5a152bcc969657fb8466ac58f7a8489.jpg" style="margin: 0; width: 100%;" alt="" />
<p style="font-size: 12px; margin: 0;">PikWizard</p>
</a>
</span>
</span>
Free (free of charge)
Free for personal and commercial use.
Author: Creative Art
Similar Free Stock Images

Premium


Premium


Premium


Premium


Premium


Premium


Premium


Premium


Premium


Premium


Premium


Premium


Premium


Premium


Premium


Premium


Premium


Premium


Premium


Premium


Premium


Premium


Premium


Premium