
- Home >
- Stock Photos >
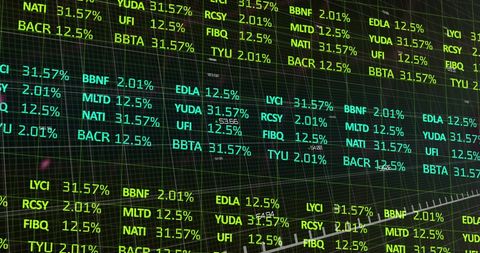
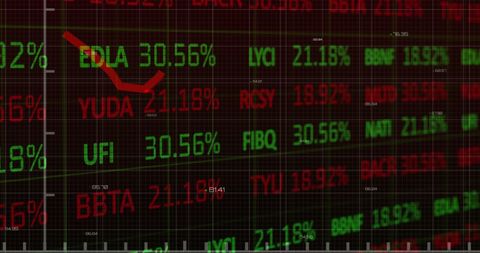
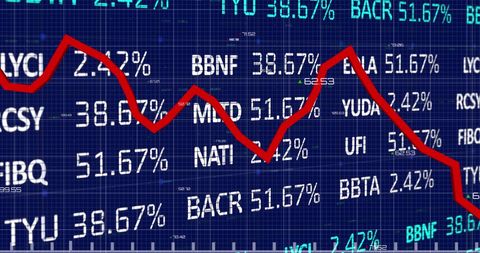
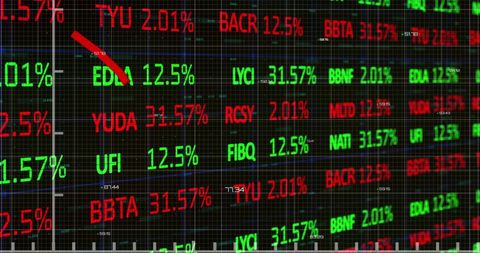
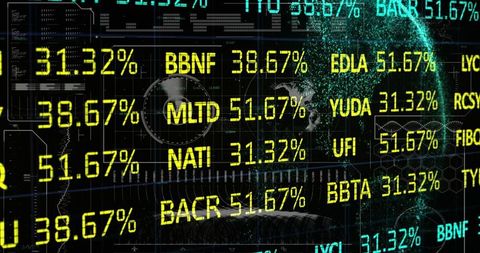
- Financial Data Through Digital Networks with Stock Market Growth Trend
Financial Data Through Digital Networks with Stock Market Growth Trend Image

Visual of digital stock market trading with data charts showcasing economic growth trends. Ideal for illustrating articles about modern financial technology, investment strategies, digital trading platforms, and global economic news. Useful for educational content related to financial literacy, stock analysis, and market predictions.
Powered by  - Get 15% off with code: PIKWIZARD15


2
downloads
downloads
Tags:
More
Credit Photo
If you would like to credit the Photo, here are some ways you can do so
Text Link
photo Link
<span class="text-link">
<span>
<a target="_blank" href=https://pikwizard.com/photo/financial-data-through-digital-networks-with-stock-market-growth-trend/09edff63c5dd4e96d5b95bfb54c53789/>PikWizard</a>
</span>
</span>
<span class="image-link">
<span
style="margin: 0 0 20px 0; display: inline-block; vertical-align: middle; width: 100%;"
>
<a
target="_blank"
href="https://pikwizard.com/photo/financial-data-through-digital-networks-with-stock-market-growth-trend/09edff63c5dd4e96d5b95bfb54c53789/"
style="text-decoration: none; font-size: 10px; margin: 0;"
>
<img src="https://pikwizard.com/pw/medium/09edff63c5dd4e96d5b95bfb54c53789.jpg" style="margin: 0; width: 100%;" alt="" />
<p style="font-size: 12px; margin: 0;">PikWizard</p>
</a>
</span>
</span>
Free (free of charge)
Free for personal and commercial use.
Author: Authentic Images
Similar Free Stock Images

Premium


Premium


Premium


Premium


Premium


Premium


Premium


Premium


Premium


Premium


Premium


Premium


Premium


Premium


Premium


Premium


Premium


Premium


Premium


Premium


Premium


Premium


Premium


Premium


Premium

