
- Home >
- Stock Photos >
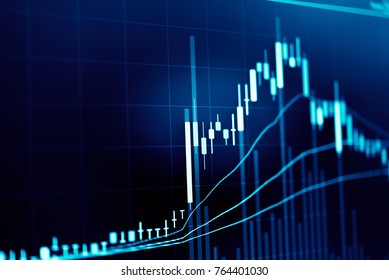
- Financial Data Trend Analysis with Graphs on Green Background
Financial Data Trend Analysis with Graphs on Green Background Image

Digitally generated image featuring diverse financial graphs and data analyses on a green background, emphasizing global finance and economy themes. Ideal for presentations, reports, and educational materials focusing on financial statistics, market trends, and economic data visualization. Suitable for use in financial articles, investment analyses, and business research.
Powered by  - Get 15% off with code: PIKWIZARD15


downloads
Tags:
More
Credit Photo
If you would like to credit the Photo, here are some ways you can do so
Text Link
photo Link
<span class="text-link">
<span>
<a target="_blank" href=https://pikwizard.com/photo/financial-data-trend-analysis-with-graphs-on-green-background/7d52d5b79277610586762747a11b628d/>PikWizard</a>
</span>
</span>
<span class="image-link">
<span
style="margin: 0 0 20px 0; display: inline-block; vertical-align: middle; width: 100%;"
>
<a
target="_blank"
href="https://pikwizard.com/photo/financial-data-trend-analysis-with-graphs-on-green-background/7d52d5b79277610586762747a11b628d/"
style="text-decoration: none; font-size: 10px; margin: 0;"
>
<img src="https://pikwizard.com/pw/medium/7d52d5b79277610586762747a11b628d.jpg" style="margin: 0; width: 100%;" alt="" />
<p style="font-size: 12px; margin: 0;">PikWizard</p>
</a>
</span>
</span>
Free (free of charge)
Free for personal and commercial use.
Author: Authentic Images
Similar Free Stock Images
Loading...

Premium


Premium
Premium


Premium


Premium

Premium


Premium


Premium


Premium

Premium


Premium


Premium


Premium


Premium


Premium


Premium

Premium


Premium


Premium


Premium

Premium


Premium

Premium


Premium


Premium
