- Home >
- Stock Photos >
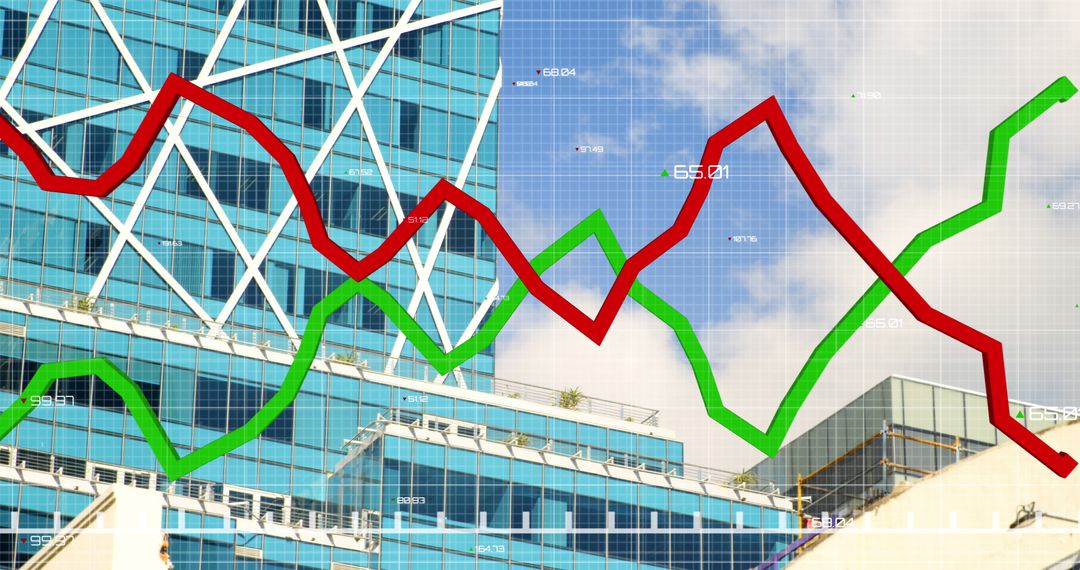
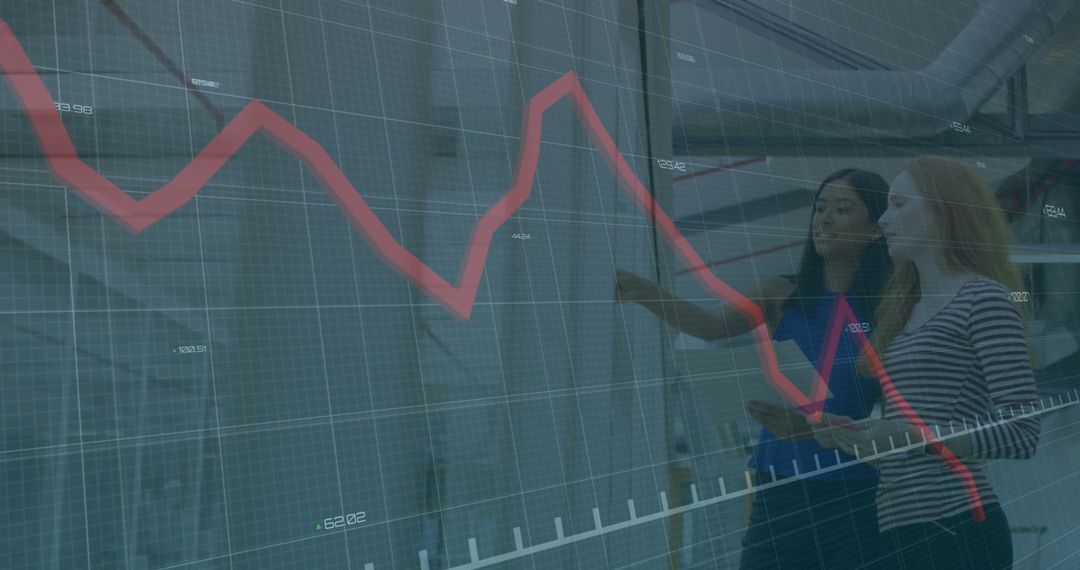
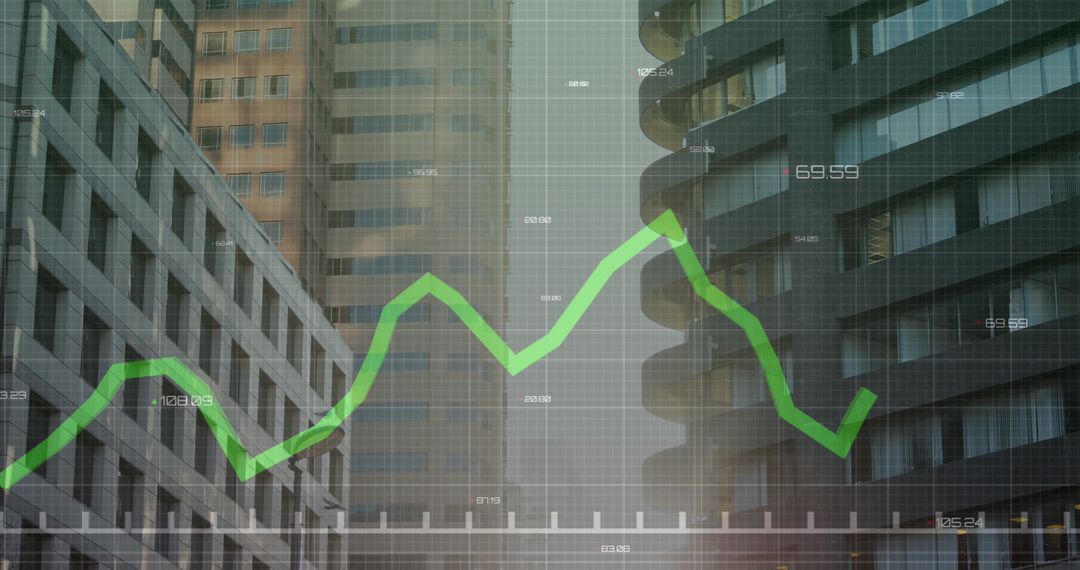
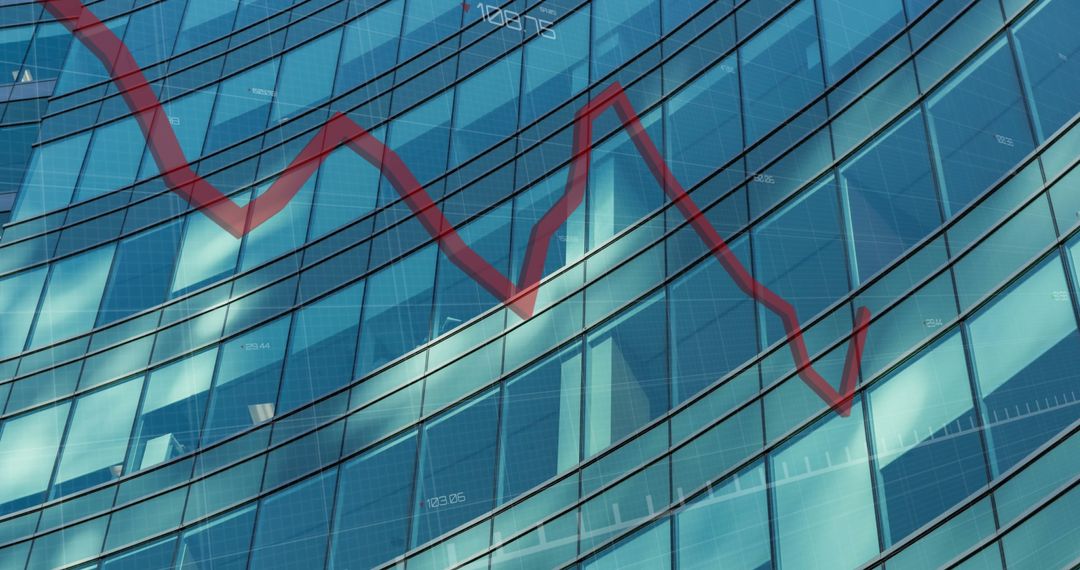
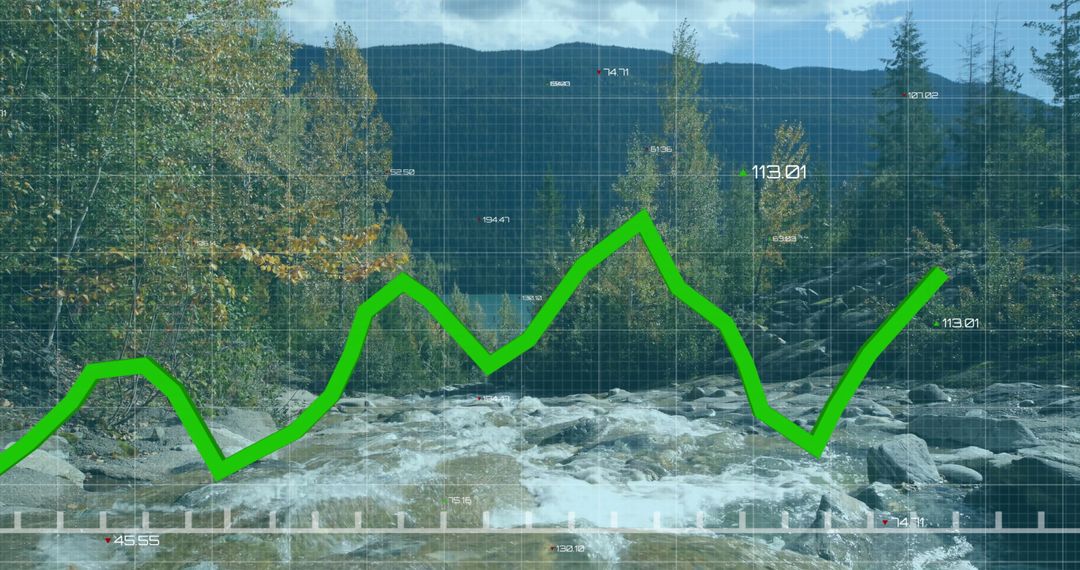
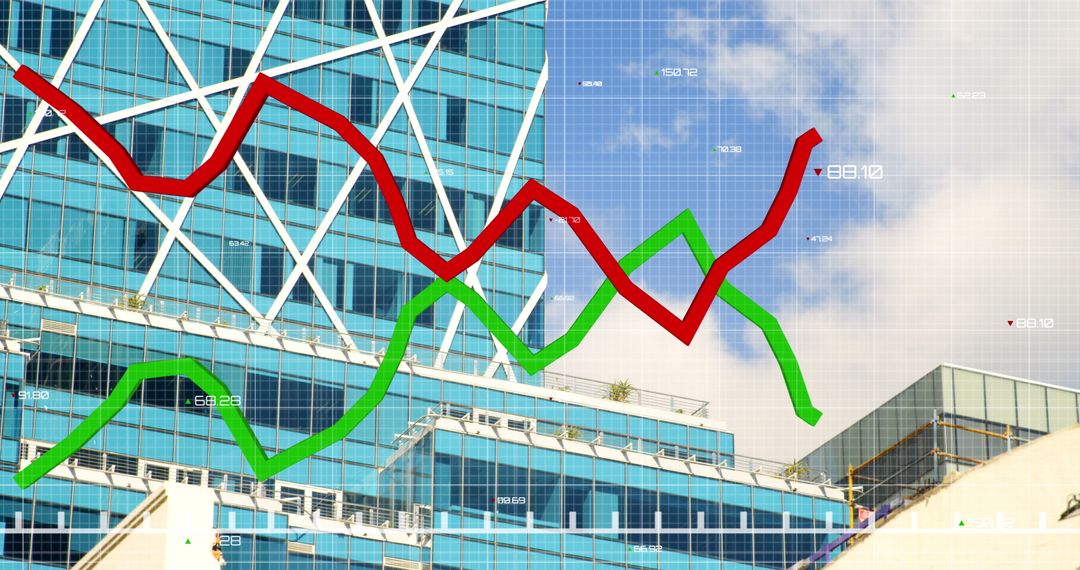
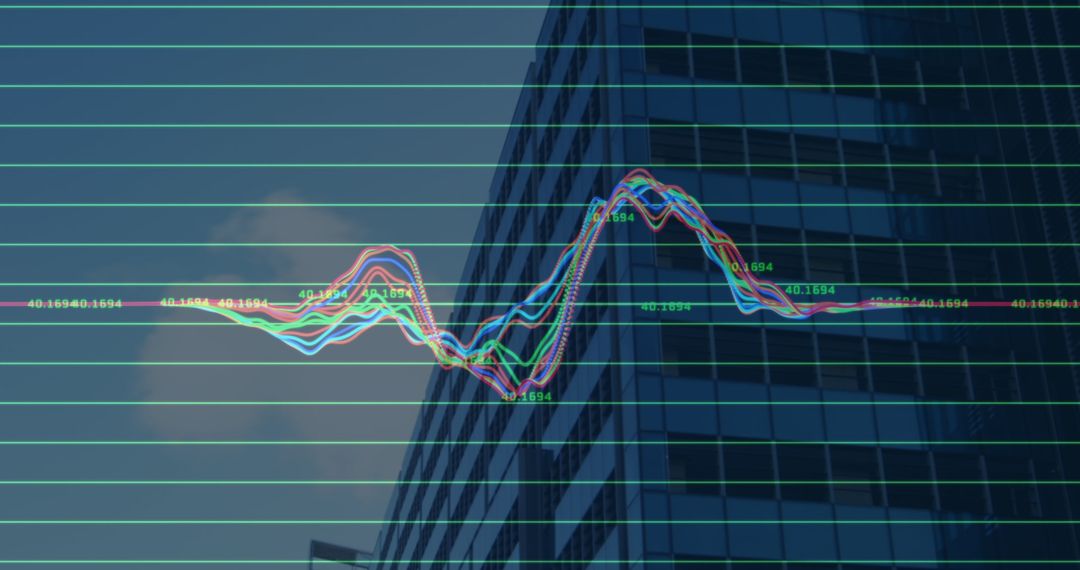
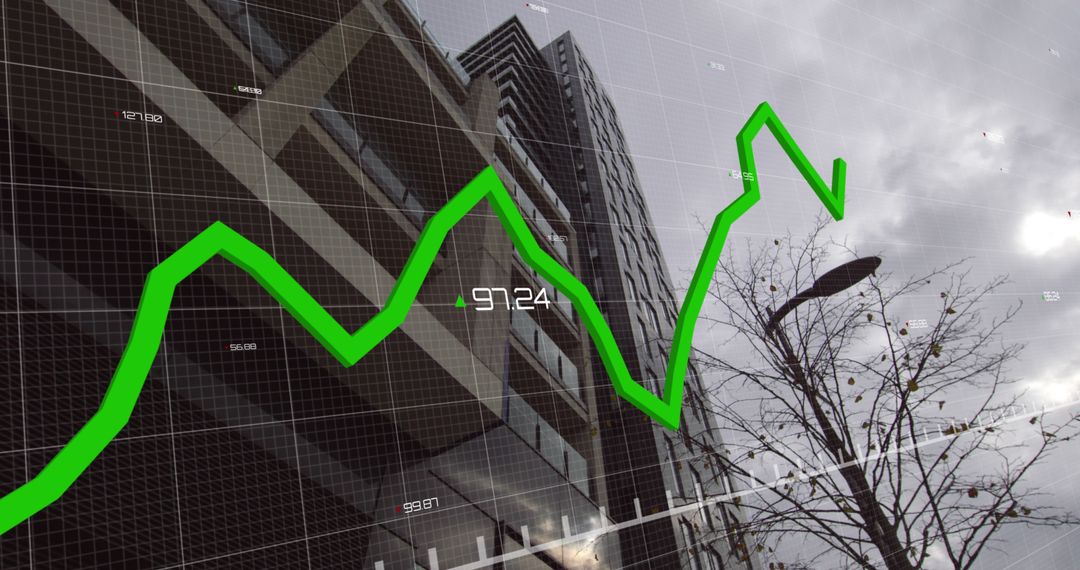
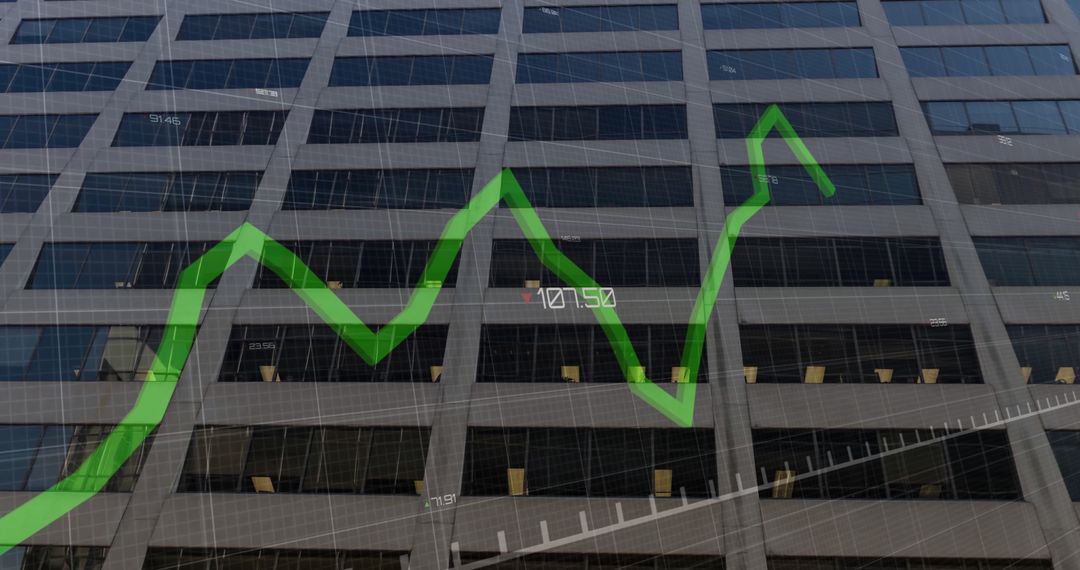
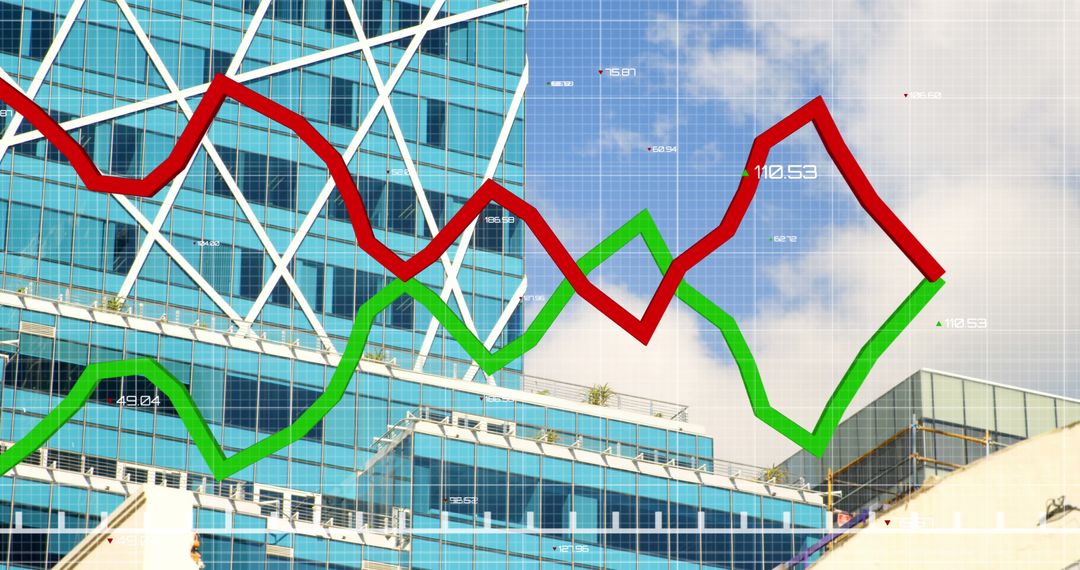
- Financial Data Trends Against Modern Skyscraper Background
Financial Data Trends Against Modern Skyscraper Background Image
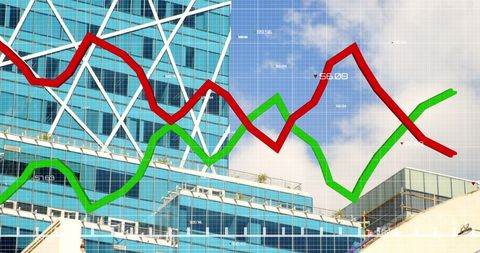
Visual of financial data trends with red and green line graphs superimposed over modern geometry of a city skyscraper architectural facade. Ideal for conveying concepts of urban financial analysis, business growth trends, and dynamic monetary journeys. Useful for business reports, financial presentations, investment brochures, and articles for financial professionals.
Powered by  - Get 15% off with code: PIKWIZARD15


2
downloads
downloads
Tags:
More
Credit Photo
If you would like to credit the Photo, here are some ways you can do so
Text Link
photo Link
<span class="text-link">
<span>
<a target="_blank" href=https://pikwizard.com/photo/financial-data-trends-against-modern-skyscraper-background/56806918b2b4fe46d442a8f70e8bd1ae/>PikWizard</a>
</span>
</span>
<span class="image-link">
<span
style="margin: 0 0 20px 0; display: inline-block; vertical-align: middle; width: 100%;"
>
<a
target="_blank"
href="https://pikwizard.com/photo/financial-data-trends-against-modern-skyscraper-background/56806918b2b4fe46d442a8f70e8bd1ae/"
style="text-decoration: none; font-size: 10px; margin: 0;"
>
<img src="https://pikwizard.com/pw/medium/56806918b2b4fe46d442a8f70e8bd1ae.jpg" style="margin: 0; width: 100%;" alt="" />
<p style="font-size: 12px; margin: 0;">PikWizard</p>
</a>
</span>
</span>
Free (free of charge)
Free for personal and commercial use.
Author: Creative Art
Similar Free Stock Images

Premium


Premium


Premium


Premium


Premium


Premium


Premium


Premium


Premium


Premium


Premium


Premium


Premium


Premium


Premium


Premium


Premium


Premium


Premium


Premium


Premium


Premium


Premium


Premium