1. Home > 
  2. Stock Photos > 
  3. Financial Data Trends with Motion and Welsh Flag Integration

Financial Data Trends with Motion and Welsh Flag Integration Image

Financial Data Trends with Motion and Welsh Flag Integration

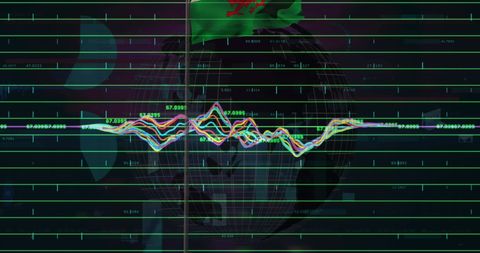
An engaging digital composition featuring dynamic lines showcasing financial data alongside evocative imagery of a waving Welsh flag superimposed on a motion-based globe. This concept suggests analytics' worldwide impacts and practical applications in global finance, ideal for business presentations, fintech platforms, economic reports, and technology-focused articles related to currency fluctuations and market predictions.

Powered by Shutterstock logo - Get 15% off with code: PIKWIZARD15
Stock market or forex trading graph on touchscreen,  finance and investment concept. Economy trends for business, financial charts and digits. - Powered by Shutterstock - Get 15% off with code: PIKWIZARD15Analysis finance grow graph and market  investment. Financial  business plan,earnings,sale and strategy. Stock market chart, exchange financial growth diagram. - Powered by Shutterstock - Get 15% off with code: PIKWIZARD15Finance analyst working on business analytics and data management system to make financial report with business performance, KPI dashboard. Corporate strategy for finance, digital marketing plan - Powered by Shutterstock - Get 15% off with code: PIKWIZARD15Man look at the dashboard with graphs and charts. Concept of data management system, business intelligence, data statistics, marketing analysis, key performance indicators (KPI) and analytics. - Powered by Shutterstock - Get 15% off with code: PIKWIZARD15Big Data Technology for Business Finance Analytic Concept. Modern graphic interface shows massive information of business sale report, profit chart and stock market trends analysis on screen monitor. - Powered by Shutterstock - Get 15% off with code: PIKWIZARD15

Credit Photo

If you would like to credit the Photo, here are some ways you can do so

Free (free of charge)

Free for personal and commercial use.

Author: People Creations

Similar Free Stock Images

Dynamic Stock Market Graph with Vibrant Color Lines on Grid
Premium
Skyscrapers with superimposed financial charts, symbolizing real estate market trends on a cloudy sky background, concept of market analysis
Digital Interface with Data Processing Visualization
Financial Graph Over Cityscape Depicting Data Trends and Analytics
Digital Stock Market Financial Data Visualization
Digital Interface with Spinning Scanner and Statistical Data
Premium
Stockmarket online trading chart candlestick on crypto currency platform. Stock exchange financial market price candles graph data pattern analysis concept. Computer screen closeup background
Dynamic Financial Charts on Global Digital Grid Background
Dynamic Data Visualisation with Futuristic Digital Display
Futuristic Digital Data Visualization with Green Interfaces
Analyzing Complex Financial Data and Market Trends
Premium
Businessman working with data management system on computer to make report with KPI and metrics connected to database. finance, operations, sales, marketing, KPI, business performance indicators.
Colorful Financial Graphs on Digital Screen with Globe
5G 6G Digital Interface With Global Connectivity Graphs
Digital Communication Data Analytics in Global Network
Futuristic Data Processing Interface with Dynamic Graphs
Premium
Stock market chart, exchange financial growth diagram.Analysis finance grow graph and market investment. Financial business plan,earnings,sale and strategy.
Financial Data Analysis on World Map Background
Stock Market Analysis and Data Processing Graphic
Dynamic Financial Data Analytics and Stock Market Trends
Data Processing with Digital Interface and Code Background
Premium
Digital economic growth chart with a rising trend towards 2025, symbolizing future market predictions.
Digital Financial Data and Stock Market Chart on Dark Interface
Digital Financial Data Over Globe with Graphs
Global Financial Data with Dynamic Analytics Visualization
Digital Data Analysis on Futuristic Black Background
Premium
Business data analytics and intelligence dashboard concept, businessman using futuristic holographic graphs and charts on laptop, big data analysis, KPIs, statistics, digital transformation.
Pulse Waveform Display with Connected Data Nodes on Grid
Futuristic Financial Dashboard with Holographic Graphs
Dynamic Data Visualization Displaying Interactive Waveforms
Analytical Trading Dashboard with Rising Candlestick Charts
Dynamic Financial Data Graph in Digital Grid Display
Rising Stock Market Trends and Chart Analysis
Premium
Man look at the dashboard with graphs and charts. Concept of data management system, business intelligence, data statistics, marketing analysis, key performance indicators (KPI) and analytics.
Fluctuating Financial Graph With Data Visualization
Dynamic Financial Data Streams for Market Analysis
Digital Financial Data Analytics and Economic Trends
Global Finance Data Analytics in Digital Display
Premium
Business strategy development and growing growth plan.	
Financial management strategy for business growth.Graph and chart. Investment of growth on currency rate.
Interactive Financial Data Analysis with Digital Technology
Digital Globe with Intersecting Graphs Representing Global Economy
Global Financial Data with Economic Trends and Analytics
Data Analysis and Cybersecurity Concept Art
Premium
Businessman using futuristic user interface with virtual data analytics. Innovative dashboard with financial charts, graphs, and global network information for business intelligence.
Digital Interface Displaying Volatile Financial Market Analysis
Glowing Data Graph Overlay on Spinning Black Globe
Digital Finance Art with Graphs and Currency Symbols Overlapping
Digital Data Analytics with Financial Graphs and Indigo Background
Premium
Businessman Drawing Upward Arrow on Digital Stock Market Graph with Trading Data, Buy and Sell Indicators, Representing Financial Growth, Investment Success Foreign currency trading and Forex Trading
Financial Graphs and Digital Data on Dark Background
Dynamic Financial Data on Dark Background With Colorful Graphs
Colorful Financial Graphs on Digital Grid Background
Digital Interface with Overlapping Code and Graph
Premium
Businessman planning digital stock market analysis strategy showing positive technology chart powerful investment ideas exchange rate economy development stock growth and business success goals
Digital Data Stream with Code Overlay on Technical Graph
Dynamic Diagrams of Data Processing on Digital Interface
Financial Chart with Dynamic Data on Black Grid
Financial Data Charts with Network Connections Digital Interface
Premium
Trends of online businesses using smartphones in 2023, buying and selling products via the internet technology network.
Dynamic Digital Display of Financial Data
Digital Earth with Data Visuals and Grid Elements in Futuristic Design
Dynamic Multicolored Waveforms in Digital Data Visualization
Colorful Stock Market Graph on Dark Grid Background Illustrating Global Economy Trends
Abstract Digital Graph with Data Points and Grid
Financial Data Analysis with Vibrant Lines on Blue Background
Premium
Business intelligence technology and big data analytic mixed media showing concept of futuristic information report using computer software to analyze strategic investment advice for decision making .
Digital Interface with Financial Data Analysis Overlay
Dynamic Stock Market Data Visualization on Digital Screen
Dynamic Stock Market Analysis with Trend Lines
Global Financial Data Analytics with Graphs on World Map
Premium
A businessman uses a laptop to access an AI-powered business analytics dashboard, showcasing charts, metrics, and KPIs. He analyzes performance data to generate. Data analysis concept.
Dynamic Financial Graphs and Charts on Black Background
Global Data Exchange Network
Digital Financial Chart Showing Growth and Dynamic Indicators
Digital Financial Data and Multicurrency Exchange Charts
Premium
businessman working with business Analytics and Data Management System on computer, online document management and metrics connected to database. Corporate strategy for finance, operations, sales.
Dynamic Financial Data Displayed on Neon Graphs
Abstract Data Visualization with Colorful Arrows and Circles
Dynamic Financial Data Visual Display with Graph Annotations
Financial Data Analysis with Interactive Graphs
Premium
Businesswoman and businessman portraits, double exposure stock market candlesticks with lines, glowing forex diagrams. Concept of trading and consulting. Copy space
Dynamic Data Graph on Dark Digital Grid Background
Digital Stock Market Data and Trends Visualization
Global Financial Data and Stock Market Trends on World Map
Digital Data Processing Concept with Graphs and Icons
Premium
AI-Artificial intelligence innovation. AI adoption and operational support. AI with digital brain, predictive analytics, data analysis. Electronic mind. Neuronet, deep machine learning concept.
Dynamic Financial Data Analysis Concept with Graph Lines and Orange Background
Financial Data Stock Analysis with Code Overlays
Dynamic Digital Stock Market Chart with Growing Financial Trends
Digital Trading Analysis with Graphs and Trendlines
Premium
Focused millennial business man analyzing marketing reports on desktop monitor, reviewing paper graphs, financial stats, startup project infographics. Marketer working from home office. Back view
Abstract Financial Data Display with Trend Lines and Bar Charts
Neon Multicolor Waveform Displaying on Tech Dashboard with Teal Gridlines and Hex Icons
Colorful Stock Market Graph with Data on Grid
Digital Data Processing Interface with Code and Graph
Financial Data Chart Over City Silhouette
Financial Graphs with Globally Inspired Data Visualization
Premium
Analyst working with Business Analytics and Data Management System on computer to make report with KPI and metrics connected to database. Corporate strategy for finance, operations, sales, marketing
Dynamic Data Analysis Visualization with Colorful Graphs
Global Financial Data Processing with Graphs and Charts Overlay
Abstract Digital Data Interface Visualization for Analytics
Digital Graphs and Interfaces Representing Data Analysis on Green Background
Premium
Futuristic Digital Growth Chart – 3D Bar Graph with Glowing Blue Data Visualization
Digital Holographic Data Interface Display
Data Processing with Virtual Grid and Cloud Imagery
Digital Data Visualization Over World Map in Network Concept
Global Network Analysis with Dynamic Digital Data
Premium
Stock market Investor analyst broker analyzing financial trade crypto stockmarket exchange platform digital chart data on computer screen thinking of investing analytic risk. Over shoulder view.
Dynamic Stock Market Graph with Data Metrics Background
Global Financial Data Analysis over World Map with Graphs
Futuristic Data Trend Graphs on Digital Interface
Financial Data Analysis with Digital Graph Overlay
Premium
Business man trader investor analyst using mobile phone app analytics for cryptocurrency financial market analysis, trading data index chart graph on smartphone and laptop screen. Over shoulder view
Abstract Data Visualization with Neon Waveforms
Stock Market Analysis with Graphs and Trading Data
Digital Data Waveform on High-Tech Interface
Abstract Data Wave Patterns on Technology Interface
Premium
Businesswoman hands working on network and digital finance marketing chart with future technology innovation and digital transformation concept, blurred background.
Financial Graph Showing Indices Trends on Blue Background
Digital Data Processing with Neon Scanner Interface
Modern Multi-Line Chart on Digital Display with Candlesticks
Dynamic Cybersecurity Data Visualization Interface Screen
Premium
Earth sphere hologram with candlesticks and growing lines. Panoramic Bangkok cityscape at night. Concept of forex and investment, online trading and global market
Holographic Finance Dashboard Displaying Glitchy Neon Data Streams, Binary Overlay