
- Home >
- Stock Photos >
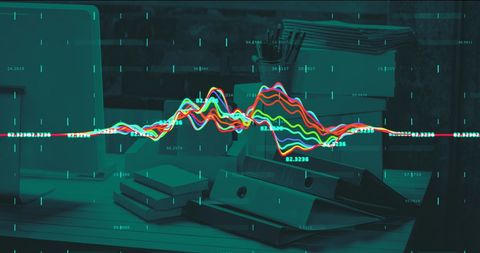
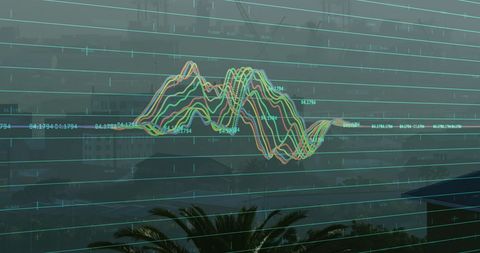
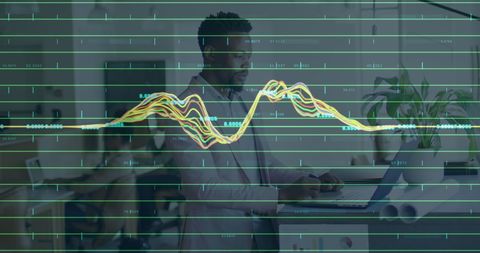
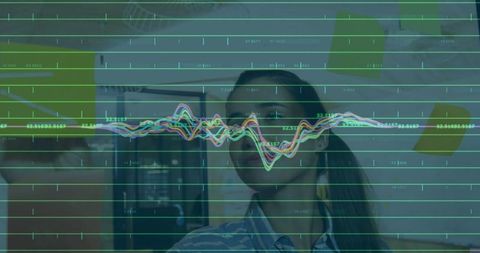
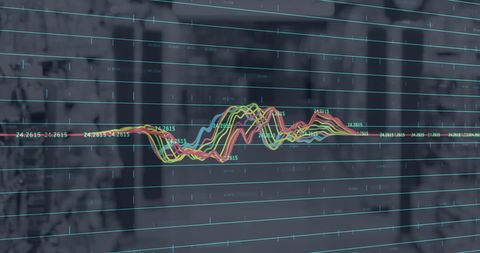
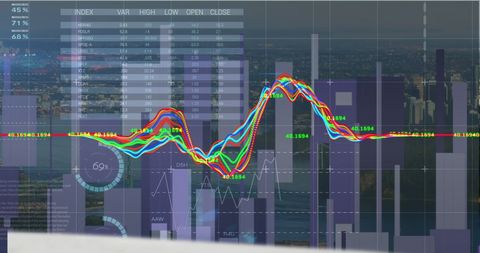
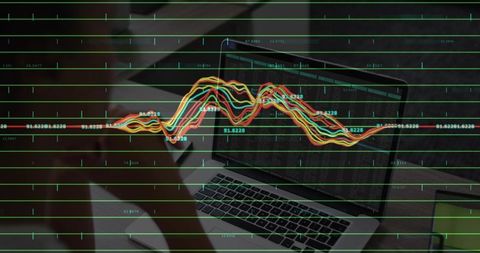
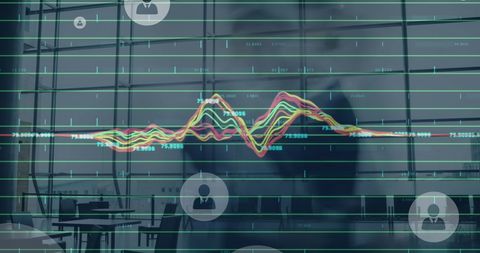
- Financial Data Visualisation in Modern Office Environment
Financial Data Visualisation in Modern Office Environment Image
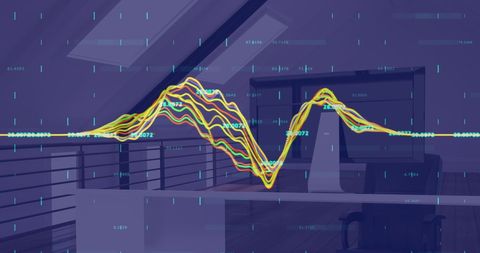
This illustration captures dynamic, colorful financial graphs overlaying a sleek, modern office setting. Ideal for visualizing futuristic finance and business analytics in a professional environment, perfect for use in presentations, marketing for financial services, or articles discussing modern data processing technology.
Powered by  - Get 15% off with code: PIKWIZARD15


downloads
Tags:
More
Credit Photo
If you would like to credit the Photo, here are some ways you can do so
Text Link
photo Link
<span class="text-link">
<span>
<a target="_blank" href=https://pikwizard.com/photo/financial-data-visualisation-in-modern-office-environment/9a2da79c9cf1fa7311e5fcdf56242c22/>PikWizard</a>
</span>
</span>
<span class="image-link">
<span
style="margin: 0 0 20px 0; display: inline-block; vertical-align: middle; width: 100%;"
>
<a
target="_blank"
href="https://pikwizard.com/photo/financial-data-visualisation-in-modern-office-environment/9a2da79c9cf1fa7311e5fcdf56242c22/"
style="text-decoration: none; font-size: 10px; margin: 0;"
>
<img src="https://pikwizard.com/pw/medium/9a2da79c9cf1fa7311e5fcdf56242c22.jpg" style="margin: 0; width: 100%;" alt="" />
<p style="font-size: 12px; margin: 0;">PikWizard</p>
</a>
</span>
</span>
Free (free of charge)
Free for personal and commercial use.
Author: Authentic Images
Similar Free Stock Images

Premium


Premium


Premium


Premium


Premium

Premium

Premium


Premium


Premium


Premium


Premium


Premium


Premium


Premium


Premium


Premium


Premium

Premium


Premium


Premium


Premium


Premium


Premium

Premium

Premium

Explore More Free Stock Images