
- Home >
- Stock Photos >
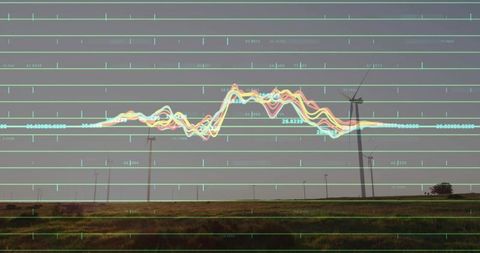
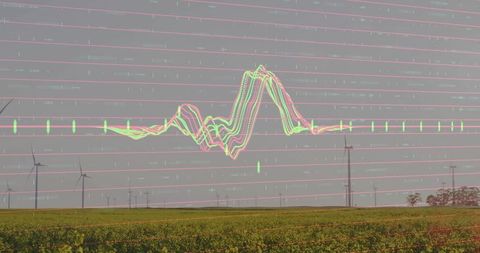
- Financial Data Visualization Above Cityscape
Financial Data Visualization Above Cityscape Image

Colorful data line graphs displayed across urban skyline illustrate concepts of business analytics and financial technology. Useful for presentations on big data impact in economy, innovative tech integration in industry, or educational resources for finance students.
Powered by 


downloads
Tags:
More
Credit Photo
If you would like to credit the Photo, here are some ways you can do so
Text Link
photo Link
<span class="text-link">
<span>
<a target="_blank" href=https://pikwizard.com/photo/financial-data-visualization-above-cityscape/bf93dbc5407b706805ed60dcc0a6a752/>PikWizard</a>
</span>
</span>
<span class="image-link">
<span
style="margin: 0 0 20px 0; display: inline-block; vertical-align: middle; width: 100%;"
>
<a
target="_blank"
href="https://pikwizard.com/photo/financial-data-visualization-above-cityscape/bf93dbc5407b706805ed60dcc0a6a752/"
style="text-decoration: none; font-size: 10px; margin: 0;"
>
<img src="https://pikwizard.com/pw/medium/bf93dbc5407b706805ed60dcc0a6a752.jpg" style="margin: 0; width: 100%;" alt="" />
<p style="font-size: 12px; margin: 0;">PikWizard</p>
</a>
</span>
</span>
Free (free of charge)
Free for personal and commercial use.
Author: Authentic Images
Similar Free Stock Images

Premium


Premium


Premium


Premium


Premium


Premium


Premium


Premium

Premium


Premium


Premium


Premium


Premium


Premium


Premium


Premium


Premium

Premium

Premium


Premium


Premium


Premium


Premium


Premium


Premium

Explore More Free Stock Images