
- Home >
- Stock Photos >
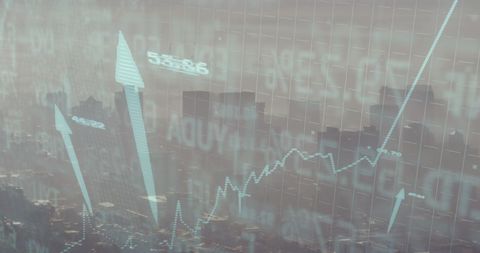
- Financial Data Visualization Against City Background
Financial Data Visualization Against City Background Image

Delivers dynamic representation of financial growth and market trends utilizing vibrant graphs and charts. Overlaying a city's blurred background, this image suggests economic prosperity within urban context. Suitable for presentations on finance, economic forecasting, investment opportunities, or corporate marketing material emphasizing progressive data insights.
Powered by 


downloads
Tags:
More
Credit Photo
If you would like to credit the Photo, here are some ways you can do so
Text Link
photo Link
<span class="text-link">
<span>
<a target="_blank" href=https://pikwizard.com/photo/financial-data-visualization-against-city-background/b0d37063052f531b6927352dbbea6dc6/>PikWizard</a>
</span>
</span>
<span class="image-link">
<span
style="margin: 0 0 20px 0; display: inline-block; vertical-align: middle; width: 100%;"
>
<a
target="_blank"
href="https://pikwizard.com/photo/financial-data-visualization-against-city-background/b0d37063052f531b6927352dbbea6dc6/"
style="text-decoration: none; font-size: 10px; margin: 0;"
>
<img src="https://pikwizard.com/pw/medium/b0d37063052f531b6927352dbbea6dc6.jpg" style="margin: 0; width: 100%;" alt="" />
<p style="font-size: 12px; margin: 0;">PikWizard</p>
</a>
</span>
</span>
Free (free of charge)
Free for personal and commercial use.
Author: Awesome Content
Similar Free Stock Images

Premium


Premium


Premium


Premium


Premium


Premium


Premium

Premium


Premium


Premium


Premium


Premium

Premium


Premium

Premium


Premium


Premium


Premium


Premium


Premium


Premium


Premium


Premium


Premium


Premium


Explore More Free Stock Images