- Home >
- Stock Photos >
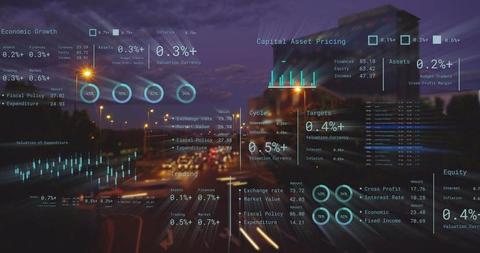
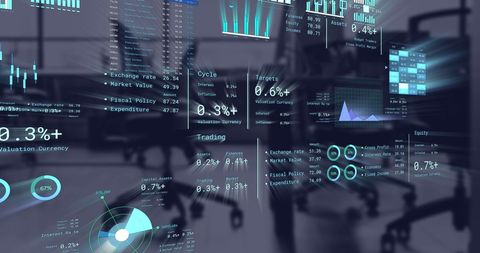
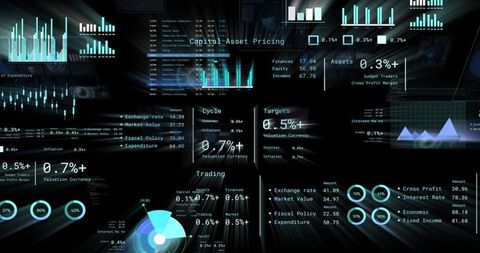
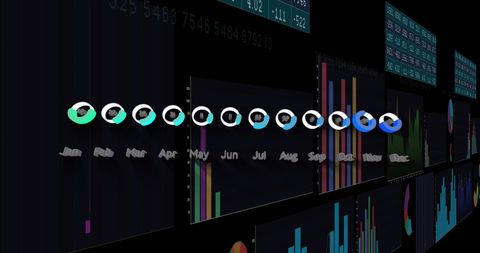
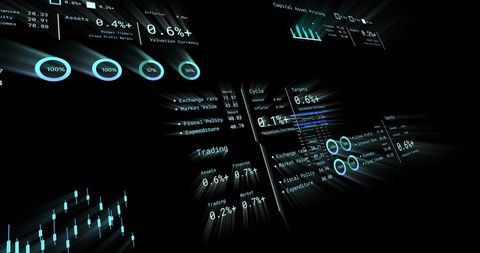
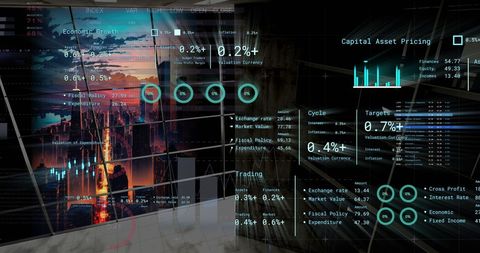
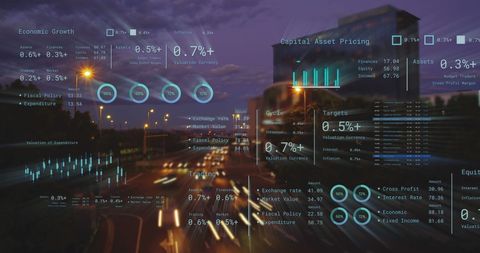
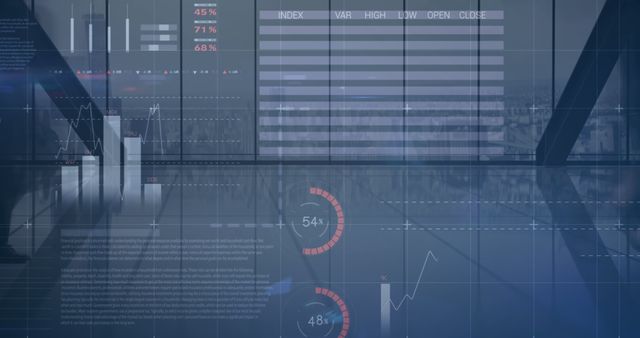
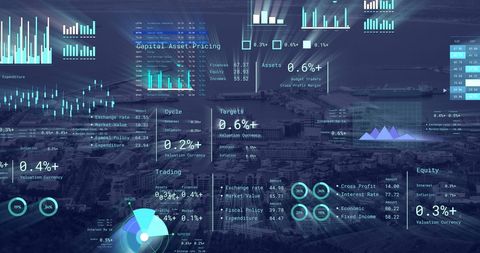
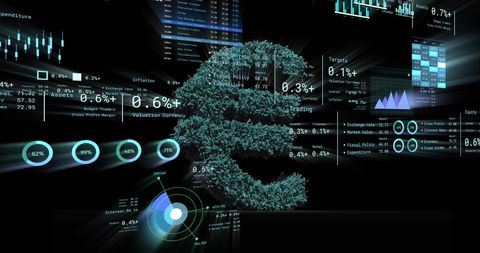
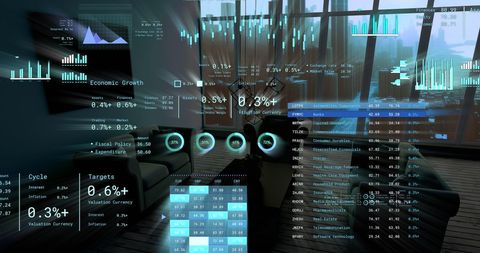
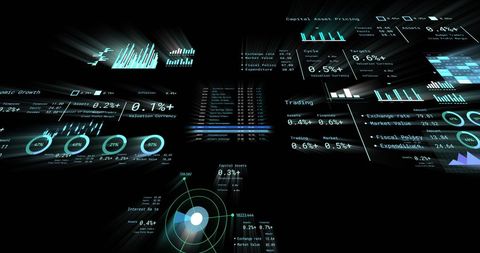
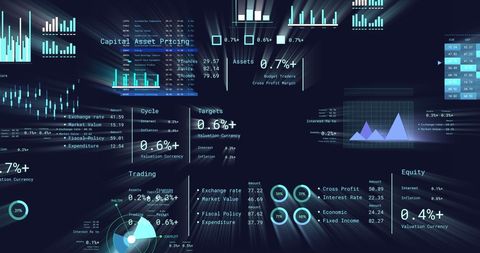
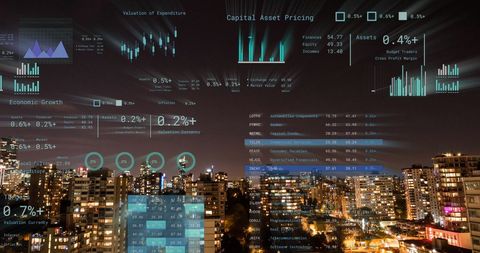
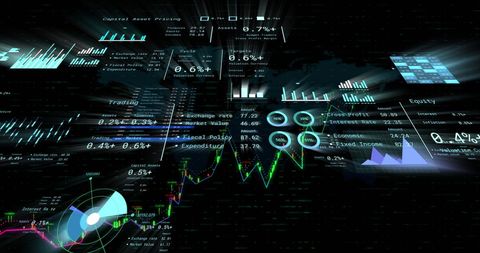
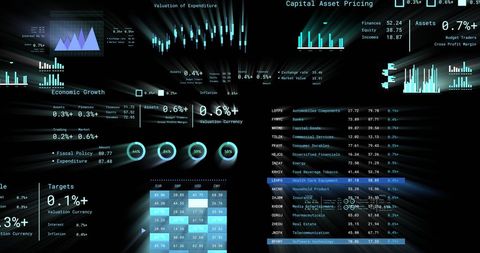
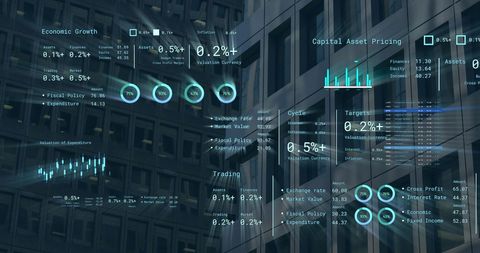
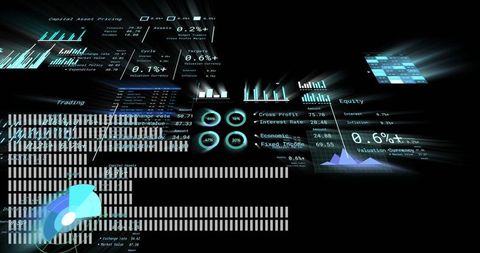
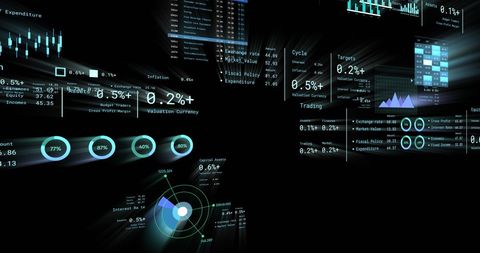
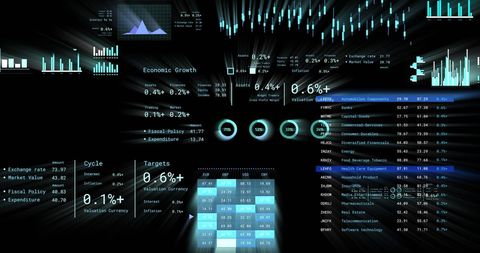
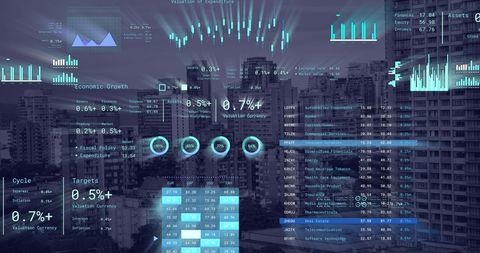
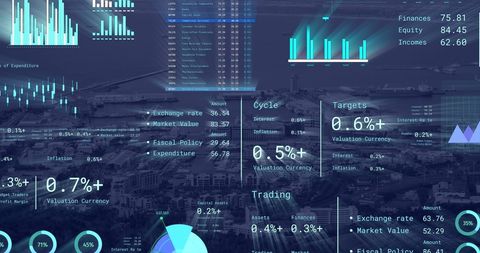
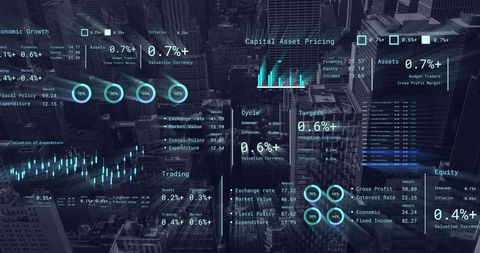
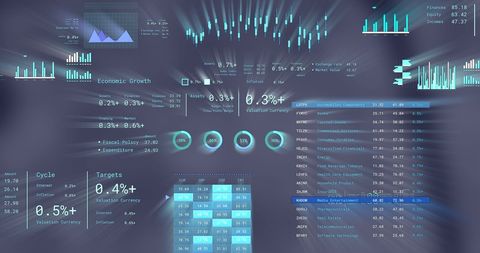
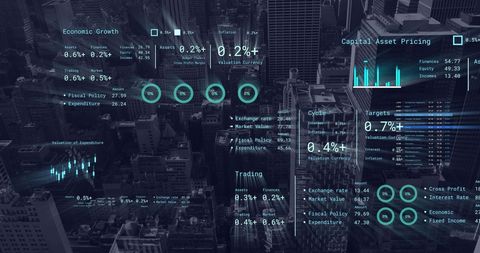
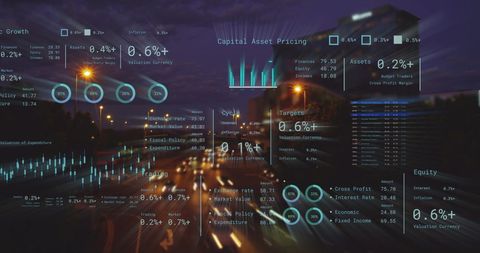
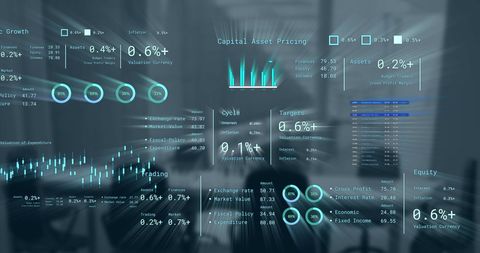
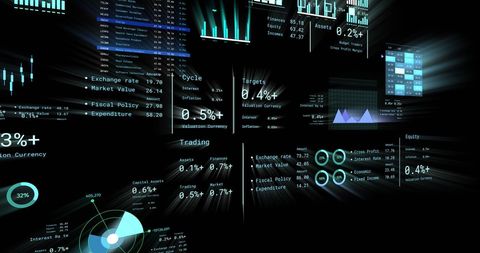
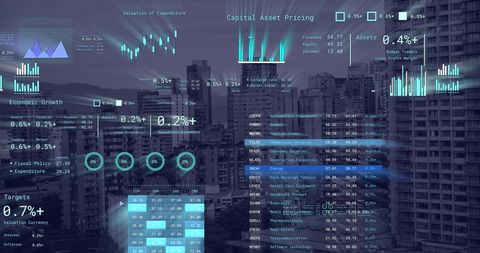
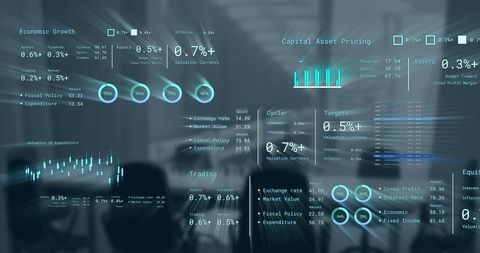
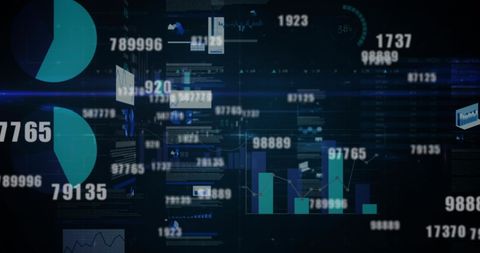
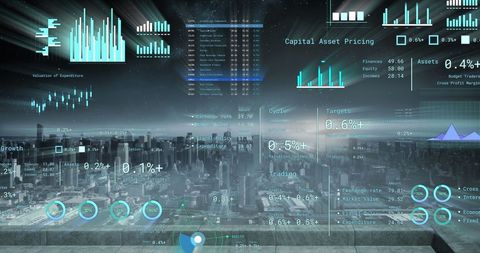
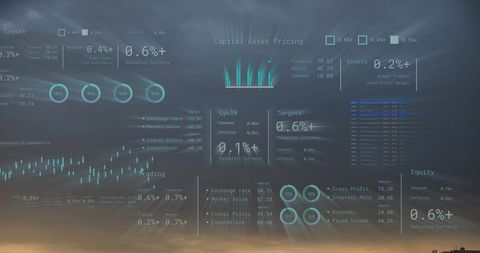
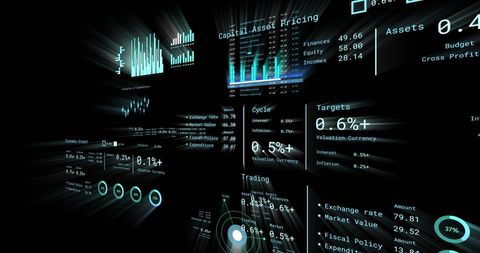
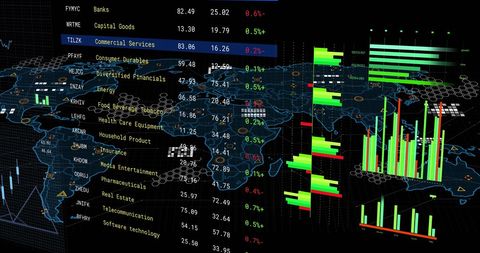
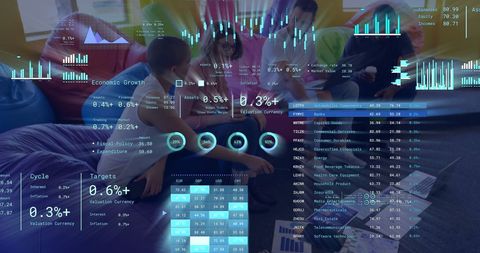
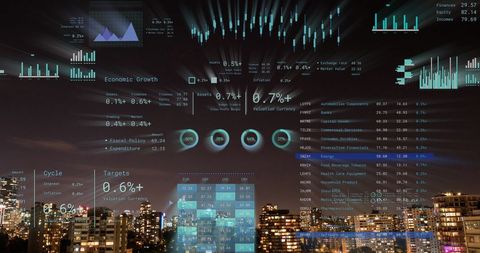
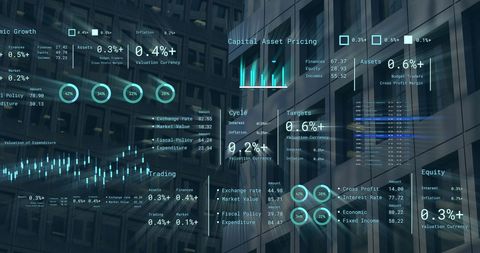
- Financial Data Visualization and Analysis with Digital Interfaces
Financial Data Visualization and Analysis with Digital Interfaces Image
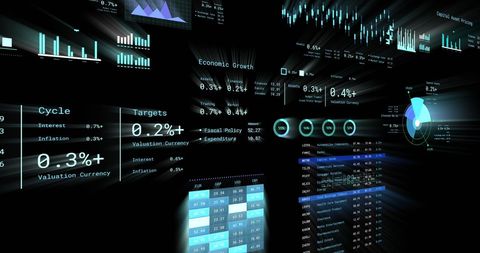
Digital representation of financial data processing with analytical graphs and charts. Highlights metrics like economic growth, inflation, and currency targets, suitable for illustrating concepts in fintech education, business presentations, and data visualization software projects. Ideal for enhancing financial or technological articles and promotional materials within economic sectors.

downloads
Tags:
More
Credit Photo
If you would like to credit the Photo, here are some ways you can do so
Text Link
photo Link
<span class="text-link">
<span>
<a target="_blank" href=https://pikwizard.com/photo/financial-data-visualization-and-analysis-with-digital-interfaces/d6c6ade8e7c7672ccb936bf99ff6a8b6/>PikWizard</a>
</span>
</span>
<span class="image-link">
<span
style="margin: 0 0 20px 0; display: inline-block; vertical-align: middle; width: 100%;"
>
<a
target="_blank"
href="https://pikwizard.com/photo/financial-data-visualization-and-analysis-with-digital-interfaces/d6c6ade8e7c7672ccb936bf99ff6a8b6/"
style="text-decoration: none; font-size: 10px; margin: 0;"
>
<img src="https://pikwizard.com/pw/medium/d6c6ade8e7c7672ccb936bf99ff6a8b6.jpg" style="margin: 0; width: 100%;" alt="" />
<p style="font-size: 12px; margin: 0;">PikWizard</p>
</a>
</span>
</span>
Free (free of charge)
Free for personal and commercial use.
Author: Authentic Images