1. Home > 
  2. Stock Photos > 
  3. Financial Data Visualization and Analysis with Office Tools

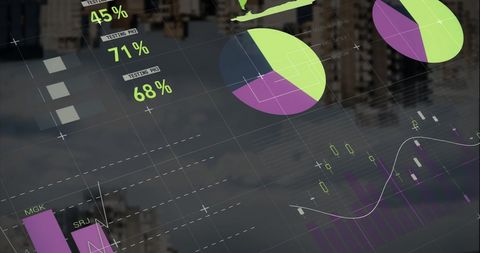
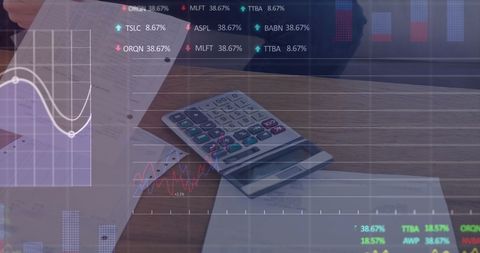
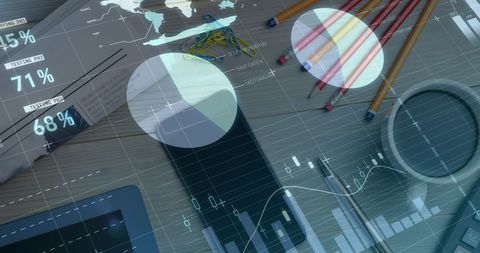
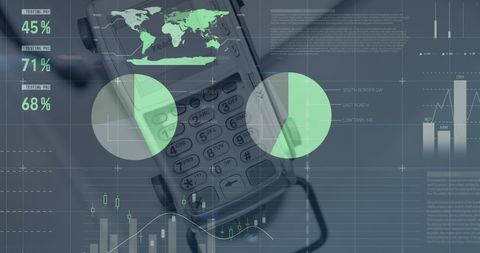
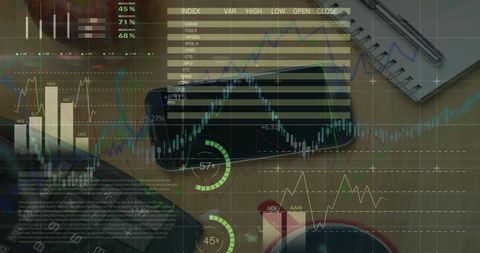
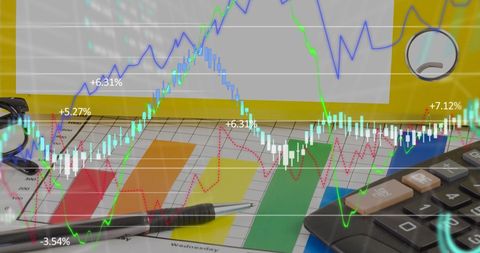
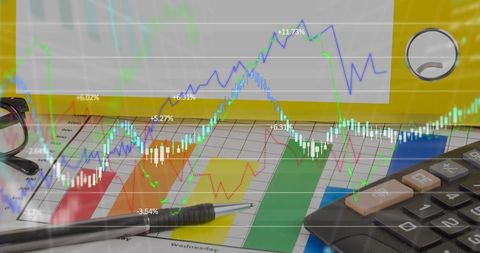
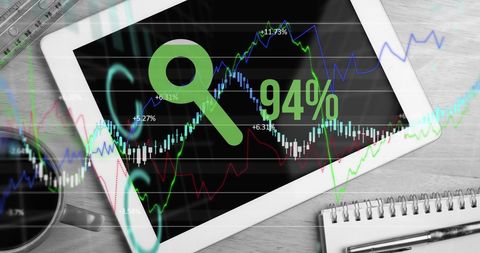
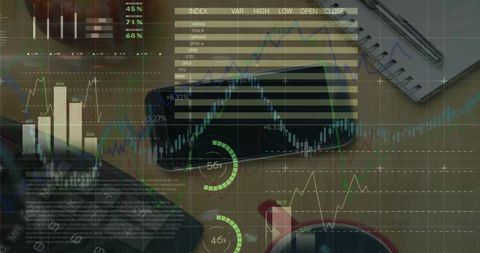
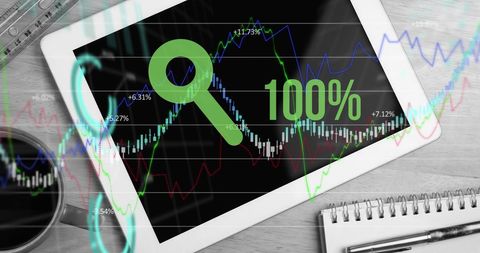
Financial Data Visualization and Analysis with Office Tools Image

Financial Data Visualization and Analysis with Office Tools

This scene combines images of office equipment with digital financial data, showing charts, graphs, and analysis indicators projected on a desk with a mobile device, notepad, and a calculator. It represents the merging of traditional office tools with modern data analytics technologies, perfect for illustrating evolving finance industries, business strategies, tech-infused workplaces, or open financial resources research projects.

Powered by Adobe logo
Hands analyzing financial data with magnifying glass showing upward trend from 2022 to 2026 on glowing chart in futuristic business concept. - Powered by AdobeProfessional Latina woman sits at desk in coworking office, focused on her work, looking at computer screen displaying financial charts and stock market data related to trading or financial analysis - Powered by AdobeMagnifying glass focusing on candlestick chart, showcasing market analysis on a dark background, concept for financial review, investment strategy and business intelligence data analysis - Powered by AdobeUsing tablet pc, Consultant between bookkeepers and accounting lawyer consultation about asset, balance sheet, stock market statistics and yearly tax law, protect business from bribery. - Powered by Adobe
Dynamic blue and green digital stock market graph with bar charts and lines on a dark background, representing financial data analysis, investment trends, business growth, and global economy fluctuat - Powered by Adobe

Credit Photo

If you would like to credit the Photo, here are some ways you can do so

Free (free of charge)

Free for personal and commercial use.

Author: Creative Art

Similar Free Stock Images

Digital Interface with Global Clock and Data Streams
Premium
Abstract glowing big data forex candlestick chart on blurry city backdrop. Trade, technology, investment and analysis concept
Digital Payment and Financial Technology Interface
Premium
Professional analyst reviews dynamic financial data visualizations on a modern laptop, driving business growth and informed decisions.
Premium
Young professional woman analyzing stock market data with tablet
Digital Financial Data Analysis on Modern Desktop Workspace
Financial Data Processing on Digital Interface with Technology Concept
Mathematical Formulae and Scientific Data Visualization Concept
Premium
Businessman working late analyzing financial data stock market charts in modern office setting
Global Data Analysis Interface with Rotating Digital Globe
Futuristic Data Analytics Dashboard with Holographic Interface
Digital Interface of Calculator and Code for Global Business Insights
Premium
Representation of data analytics,charts, graphs and data driven insights emerging from a sea of information
Global Data Visualization with Charts and World Map Elements
Mathematical Equations with Digital Statistical Analysis
Financial Analysis with Mathematical Formulas and Calculations
Analyzing Financial Data Overlay with Diverse Professionals
Global Business Analytics and Financial Market Data Visualization
Premium
Businesswoman typing on laptop with digital financial chart overlay, representing data analysis, stock market trends, economic growth, investment, business strategy, and modern technology.
Premium
Analyzing financial data on a smartphone, with charts and graphs in the background
Financial Data Analysis with Smartphone and Digital Interface
Premium
Dynamic financial chart overlaying stunning cityscape at night, symbolizing growth and opportunity in the modern business world with vibrant colors
Premium
Financial market analysis with stock graph overlay and industrial skyline at dusk
Businesswoman Analyzing Data with Charts and Laptop in Modern Workspace
Data Processing and Analytics Visualization on Digital Interface
Digital Interface with Graphs and Network Connections for Data Processing
Financial Data Overlay with Office Supplies and Graphs
Premium
Upward market arrow on digital chart expressing business growth financial performance improvement and confident data driven strategy execution.
Premium
AI finance business data analysis digital technology investment trading market stock, financial analyst using advanced holographic interface for global market insight, smart investment strategy
Abstract Financial Data Overlay on Server Room
Digital Finance Overlay on US Dollars and Notebook
Digital Asymmetry in Financial Harbors Internal Audit Compliance PTSD and Designs Foundation Classic
Data Processing Overlay on IT Engineer with Technology Interface
Digital Data Network and Processing Interface
Digital Finance Data Visualized on Workspace Desk Overlay
Data Processing Technology in Modern Office Environment
Multicolored Infographic Interface Over Cityscape
Premium
Magnifying glass highlights business growth chart with upward trend. Generative AI analysis financial success stock increase profit investment statistic performance market economy improvement
Global Data Processing Over Digital Interface Screens
Financial Data Analysis Plus Equity Market Trends
Premium
Drive your business growth like a pro with data-driven insights for financial success and prosperity
Global Financial Data and Mathematical Integration Concept
Digital Financial Analytics Overlaid on Office Desk
Stock Market Analysis with Digital Composite of Cityscape
Financial Data Analysis and Growth Indicators Display
Premium
Finance trade manager analyzing stock market indicators for best investment strategy, financial data and charts, digital ai
Businesswoman Analyzing Financial Graphs on Laptop and Smartphone
Abstract Global Financial Data and Technology Interface
Digital Finance Technology Concept with Data and Payment Systems
Data Processing Overlay on Urban Landscape with Graph
Digital Infographics and Counselling Concept Overlaid on Notepad
Abstract Digital Interface with Data Visualizations over Cityscape
Financial Data Analysis on Office Desk with Gadgets and Graphs
Digital Data Processing and Statistics Visualization
Premium
Data analyzing and stock market visualization with digital charts, financial dashboards, and performance metrics. Ideal for investment analysis, trading strategy, and economic forecasting.
Premium
Close-up of a digital screen displaying financial stock market data with graphs and analytics, illustrating market trends and investment analysis.
Abstract Technology Overlay: Graphs and Mobile Payment Terminal
Futuristic Statistical Data Overlay on Office Desk
Abstract Global Data Analytics Interface with Cityscape Background
Wireless Payment Terminal with Graph Analysis Overlay
Premium
dynamic city skyline merges with financial data, reflecting economic growth and urban development. vibrant scene captures essence of modern business and technology
Futuristic Financial Chart Overlay with Cityscape Background
Digital Financial Data and Security Analysis Concept
Collaborative Team Analyzing Graphical Data Trends
Premium
glowing financial stock market chart with a rising arrow for business success, data analysis, and investment concepts
Circular Scanner with Data Interface in Modern Server Room
Overlay of Financial Charts on Office Desk Setup
Digital Financial Analysis With Technology Integration
Financial Data Analysis and Business Technology Concept
Premium
Transparent or png stock market investment trading graph growth.Trade business analytics graph and financial chart.
Abstract Analytics and Data Server Room United for Strategic Review
Digital Data Processing with Global Interface Elements
Financial Data and Technology Integration on Desk Setup
Calculator Overlaying Dynamic Stock Market Data Background
Digital Interface with Global Data Analytics Concepts
Digital Interface with Mathematical Equations and Pie Charts
Digital Data Analytics Interface with Statistical Graphs
Analyzing Rising Financial Data on Digital Tablet
Social Media Reactions Overlaying Data and Analytics Background
Futuristic Data Analytics Interface in Empty Office Environment
Data Analysis Dashboard Overlaid on Night City Traffic Background
Futuristic Digital Data Matrix with Statistical Graphics
Dynamic Financial Data and Stats Overlay in Global Business Context
Dynamic Financial Data Visualization Over Black Background
Digital Data Streams Overlay on Business Calculator
Digital Interface Overlay on Business Desk for Financial Analysis
Smartphone Icon Amidst Digital Data Flow
Neon Teal HUD Dashboard Showing Green Semi-Transparent Pie Charts, World Map Analytics
Premium
Businessman holding paper report with financial charts and graphs overlayed, modern graphic style on white background, concept of market analysis
Global Digital Data Interface with Charts and Graphs
Futuristic Network Data Analysis with VR Technology
Financial Data Analysis with Tablet and Growth Chart
Digital Data Interface with Glowing Globe and Analysis Graphs
Premium
Business financial chart with moving up arrow graph.Financial data charts with glowing stock market graphs.Stock market investment data and analysis finance graph.
Futuristic Data Interface in Modern Office Setting
Digital Financial Data Analytics Over Urban Background
Digital Financial Analysis Over Office Desk with Tech Gadgets
Digital Interface with Financial and Statistical Data Visualizations
Business Team Interacting with Futuristic Digital Data Interface
Futuristic Digital Data Interface Over Urban Landscape
Digital Financial Data Overlays American Dollar Bills
Data Analysis Overlapping Tech Graphics on Server Lights
Financial Data Analytics on Desk with Smartphone and Notebook
Futuristic Data and Statistics Interface in Modern Server Room
Digital Financial Analysis with Mathematical Equations
Premium
Financial advisor explaining invest stock market data consulting investor. Two busy business men analysts doing finance trading analysis pointing at exchange chart on laptop screen working in office.
Construction Site with Financial Data Overlay and Digital Interface
Premium
Business Financing Accounting Banking Concept, Businesswoman doing finances and calculating financial report with business graph growth cahrt, finance and investment concept
Charts and Calculator Overlapping Financial Documents Concept
High-Tech Data Analysis Interface with Graphs and Viewfinder
Premium
Businessman works on laptop Showing business analytics dashboard with charts, metrics, and KPI to analyze performance and create insight reports for operations management. Data analysis concept.Ai
Premium
stock market visual metaphor concept. A crystal ball displaying financial graph trends on a dark cushion.
Data Analysis and Finance Concept with Graphs and Maps
Tablet Displaying Financial Graph with Growing Percentage on Desk
Digital Interface Displaying Data Analysis and Mathematical Equations
Global Data Processing with Digital Interface Concepts
Digital Data Interface with Statistical Analysis and Charts
Financial Data Analysis with Global Statistical Overlay
Financial Data Analysis with Charts and Calculator on Desk
Financial Data Processing on Desk with Digital Overlay
Futuristic Data Processing with Speedometer and Digital Interface
Digital Skull with Data Analytics in Cybersecurity Display
Digital Payment with Data Analytics Interface Screen
Analyzing Financial Data on Smartphone Technology Concept
Digital Screen Displaying Business Analytics and Data Visualization
Explore More Free Stock Images