
- Home >
- Stock Photos >
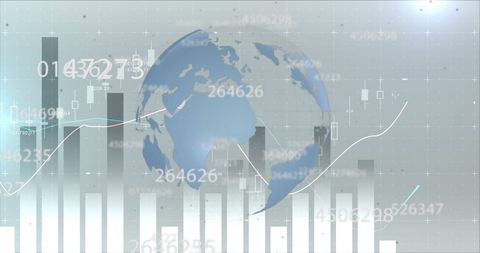
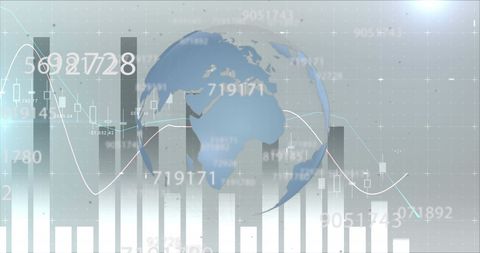
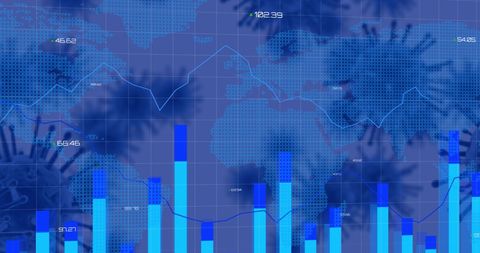
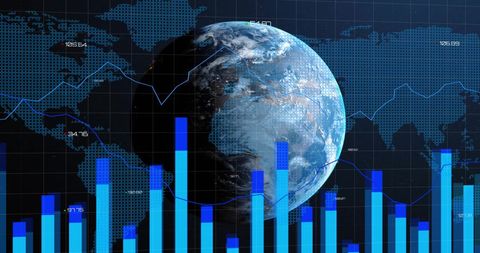
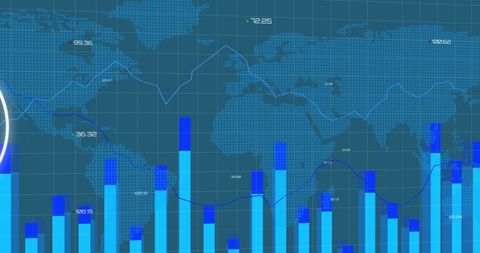
- Financial Data Visualization and Digital Analysis with World Map
Financial Data Visualization and Digital Analysis with World Map Image

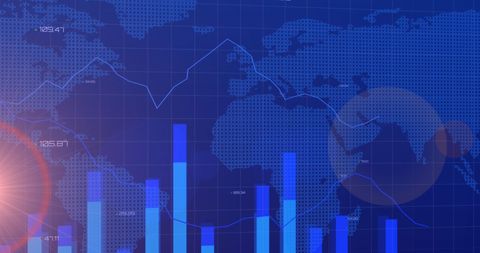
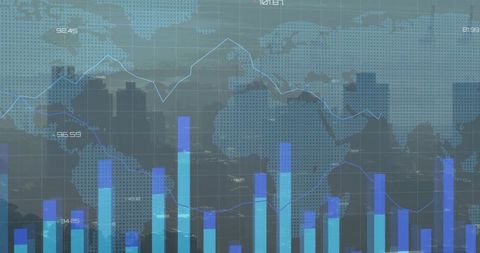
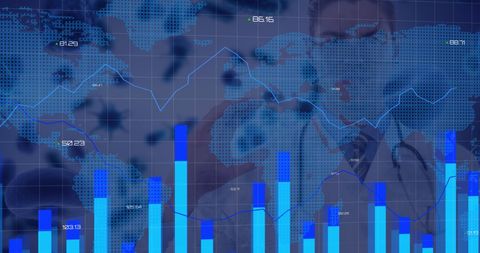
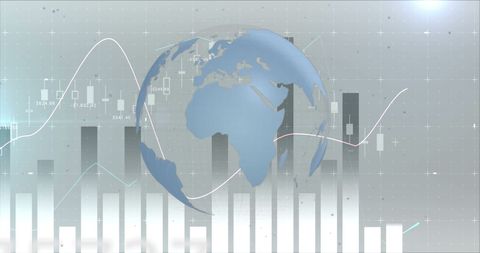
This illustration showcases graphs overlaying a global map, emphasizing financial data visualization and digital analysis. Ideal for presentations on global business trends, financial market analysis, or technological integration in economic strategies and forecasting models. Could be used in articles related to finance, technology innovations, and international marketplace developments.
Powered by 


downloads
Tags:
More
Credit Photo
If you would like to credit the Photo, here are some ways you can do so
Text Link
photo Link
<span class="text-link">
<span>
<a target="_blank" href=https://pikwizard.com/photo/financial-data-visualization-and-digital-analysis-with-world-map/af344d4f997f18b09e1cfff7fae6b362/>PikWizard</a>
</span>
</span>
<span class="image-link">
<span
style="margin: 0 0 20px 0; display: inline-block; vertical-align: middle; width: 100%;"
>
<a
target="_blank"
href="https://pikwizard.com/photo/financial-data-visualization-and-digital-analysis-with-world-map/af344d4f997f18b09e1cfff7fae6b362/"
style="text-decoration: none; font-size: 10px; margin: 0;"
>
<img src="https://pikwizard.com/pw/medium/af344d4f997f18b09e1cfff7fae6b362.jpg" style="margin: 0; width: 100%;" alt="" />
<p style="font-size: 12px; margin: 0;">PikWizard</p>
</a>
</span>
</span>
Free (free of charge)
Free for personal and commercial use.
Author: Authentic Images
Similar Free Stock Images

Premium


Premium


Premium


Premium


Premium

Premium

Premium


Premium


Premium


Premium

Premium


Premium


Premium


Premium


Premium


Premium


Premium


Premium


Premium


Premium


Premium


Premium


Premium


Premium


Premium

Explore More Free Stock Images