
- Home >
- Stock Photos >
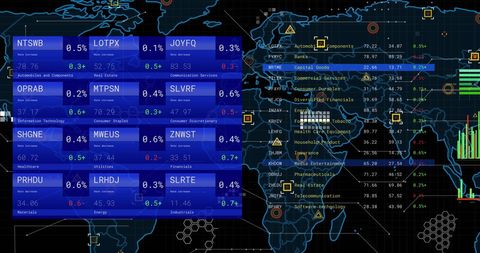
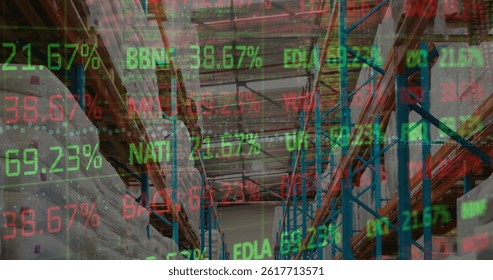
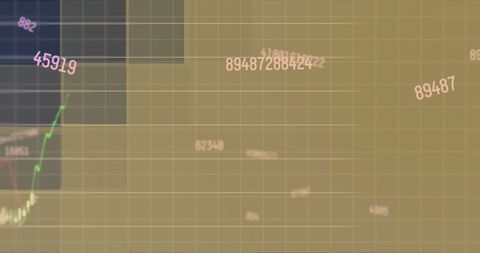
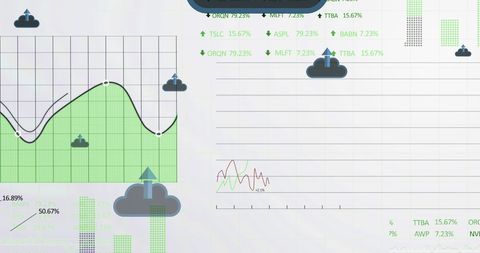
- Financial Data Visualization in a Digital Platform
Financial Data Visualization in a Digital Platform Image
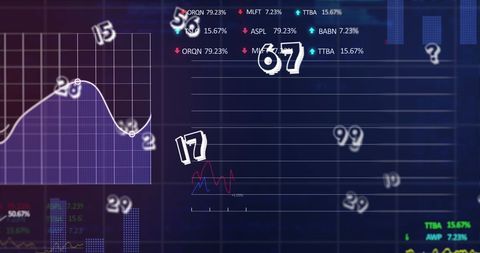
Presented is an interactive digital display with financial data visualization featuring numbers, graphs, and analytical charts. Ideal for illustrating concepts related to the stock market, global business finance, and data-driven investment strategies. This image is suitable for educational content, economic reports, or resources discussing digital trading platforms and modern financial technology.
Powered by  - Get 15% off with code: PIKWIZARD15


downloads
Tags:
More
Credit Photo
If you would like to credit the Photo, here are some ways you can do so
Text Link
photo Link
<span class="text-link">
<span>
<a target="_blank" href=https://pikwizard.com/photo/financial-data-visualization-in-a-digital-platform/25f1cb25977e2cb4f309b58929f015c2/>PikWizard</a>
</span>
</span>
<span class="image-link">
<span
style="margin: 0 0 20px 0; display: inline-block; vertical-align: middle; width: 100%;"
>
<a
target="_blank"
href="https://pikwizard.com/photo/financial-data-visualization-in-a-digital-platform/25f1cb25977e2cb4f309b58929f015c2/"
style="text-decoration: none; font-size: 10px; margin: 0;"
>
<img src="https://pikwizard.com/pw/medium/25f1cb25977e2cb4f309b58929f015c2.jpg" style="margin: 0; width: 100%;" alt="" />
<p style="font-size: 12px; margin: 0;">PikWizard</p>
</a>
</span>
</span>
Free (free of charge)
Free for personal and commercial use.
Author: Creative Art
Similar Free Stock Images

Premium


Premium
Premium


Premium


Premium


Premium


Premium


Premium
Premium
Premium

Premium


Premium


Premium


Premium


Premium


Premium


Premium


Premium


Premium


Premium


Premium

Premium


Premium


Premium


Premium


Explore More Free Stock Images