- Home >
- Stock Photos >
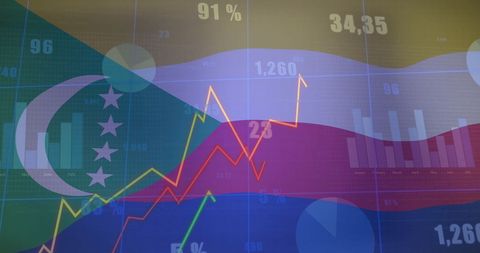
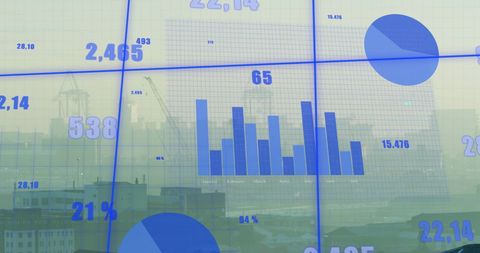
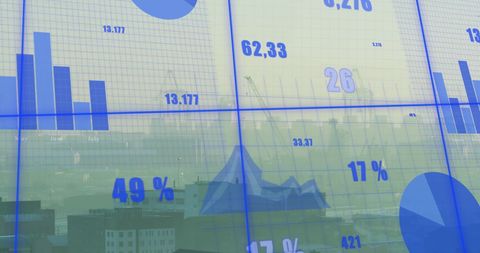
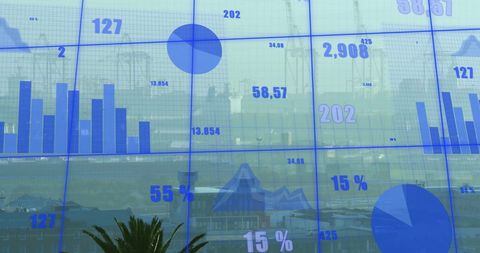
- Financial Data Visualization in Blue with Dynamic Graphics
Financial Data Visualization in Blue with Dynamic Graphics Image

Dynamic financial data visualization in shades of blue featuring charts and numerical metrics, signifying digital analysis. Suitable for illustrating concepts of global business, financial reports, data analysis, and technology-driven finance systems. Ideal use in presentations, financial reports, and blogs related to economic trends and data processing.

downloads
Tags:
More
Credit Photo
If you would like to credit the Photo, here are some ways you can do so
Text Link
photo Link
<span class="text-link">
<span>
<a target="_blank" href=https://pikwizard.com/photo/financial-data-visualization-in-blue-with-dynamic-graphics/20622d93d5867be415c529075872357f/>PikWizard</a>
</span>
</span>
<span class="image-link">
<span
style="margin: 0 0 20px 0; display: inline-block; vertical-align: middle; width: 100%;"
>
<a
target="_blank"
href="https://pikwizard.com/photo/financial-data-visualization-in-blue-with-dynamic-graphics/20622d93d5867be415c529075872357f/"
style="text-decoration: none; font-size: 10px; margin: 0;"
>
<img src="https://pikwizard.com/pw/medium/20622d93d5867be415c529075872357f.jpg" style="margin: 0; width: 100%;" alt="" />
<p style="font-size: 12px; margin: 0;">PikWizard</p>
</a>
</span>
</span>
Free (free of charge)
Free for personal and commercial use.
Author: Awesome Content