- Home >
- Stock Photos >
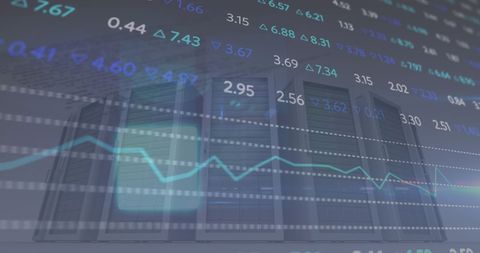
- Financial Data Visualization in Modern Digital Display Office
Financial Data Visualization in Modern Digital Display Office Image

Highlighting complex financial data, this image features a digital visualization showing fluctuating stock prices and market trends displayed over a transparent background of an empty office space. Ideal for financial services presentations, stock market training, fintech blogs, or business websites focusing on investment analysis and forecasting in a high-tech environment.

downloads
Tags:
More
Credit Photo
If you would like to credit the Photo, here are some ways you can do so
Text Link
photo Link
<span class="text-link">
<span>
<a target="_blank" href=https://pikwizard.com/photo/financial-data-visualization-in-modern-digital-display-office/af6c7aadd7a6baa13ca9b09e3b26d1a2/>PikWizard</a>
</span>
</span>
<span class="image-link">
<span
style="margin: 0 0 20px 0; display: inline-block; vertical-align: middle; width: 100%;"
>
<a
target="_blank"
href="https://pikwizard.com/photo/financial-data-visualization-in-modern-digital-display-office/af6c7aadd7a6baa13ca9b09e3b26d1a2/"
style="text-decoration: none; font-size: 10px; margin: 0;"
>
<img src="https://pikwizard.com/pw/medium/af6c7aadd7a6baa13ca9b09e3b26d1a2.jpg" style="margin: 0; width: 100%;" alt="" />
<p style="font-size: 12px; margin: 0;">PikWizard</p>
</a>
</span>
</span>
Free (free of charge)
Free for personal and commercial use.
Author: Creative Art