
- Home >
- Stock Photos >
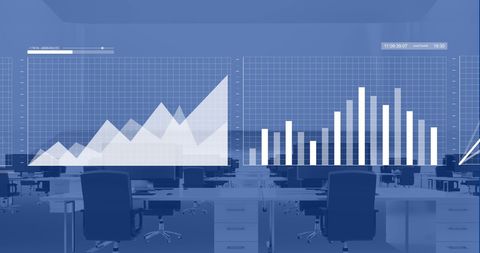
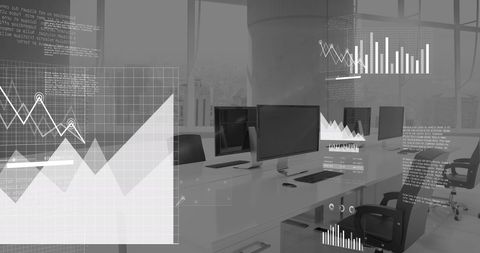
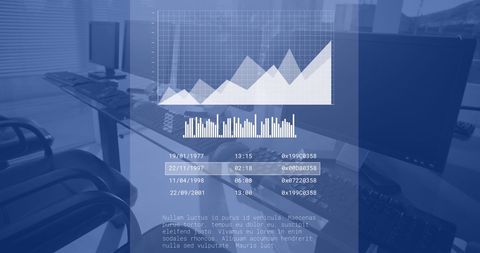
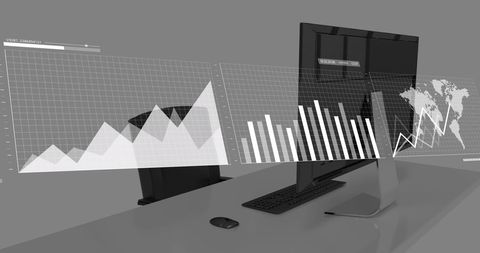
- Financial Data Visualization in Modern Office
Financial Data Visualization in Modern Office Image

An image showcasisng digital graphs and charts superimposed over empty office desks highlights data processing in a modern business environment. Keywords like finance and data analytics help SEO users find relevant content quickly. This visual can be used as a corporate presentation background, in business articles focusing on analytics, or in marketing materials for financial technology services.
Powered by 


downloads
Tags:
More
Credit Photo
If you would like to credit the Photo, here are some ways you can do so
Text Link
photo Link
<span class="text-link">
<span>
<a target="_blank" href=https://pikwizard.com/photo/financial-data-visualization-in-modern-office/3a3296800235f4ebe7da678b524fecd4/>PikWizard</a>
</span>
</span>
<span class="image-link">
<span
style="margin: 0 0 20px 0; display: inline-block; vertical-align: middle; width: 100%;"
>
<a
target="_blank"
href="https://pikwizard.com/photo/financial-data-visualization-in-modern-office/3a3296800235f4ebe7da678b524fecd4/"
style="text-decoration: none; font-size: 10px; margin: 0;"
>
<img src="https://pikwizard.com/pw/medium/3a3296800235f4ebe7da678b524fecd4.jpg" style="margin: 0; width: 100%;" alt="" />
<p style="font-size: 12px; margin: 0;">PikWizard</p>
</a>
</span>
</span>
Free (free of charge)
Free for personal and commercial use.
Author: Awesome Content
Similar Free Stock Images

Premium

Premium

Premium


Premium


Premium


Premium


Premium


Premium


Premium


Premium


Premium

Premium


Premium


Premium


Premium


Premium


Premium


Premium


Premium


Premium


Premium


Premium


Premium


Premium


Premium


Explore More Free Stock Images