
- Home >
- Stock Photos >
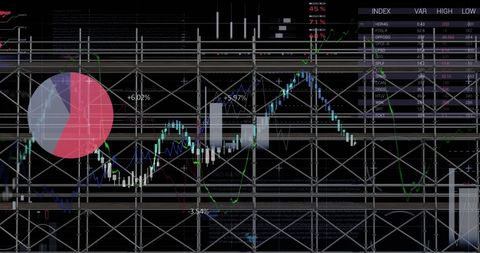
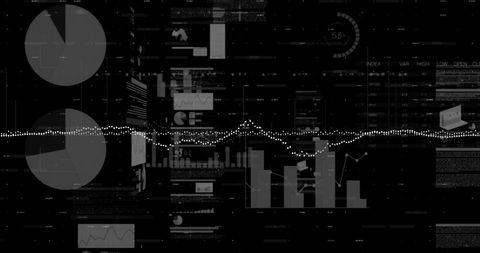
- Financial Data Visualization on Black Background
Financial Data Visualization on Black Background Image

Dynamic graphical representation highlighting financial data sentiments using line graphs, bar charts, and numerical data. Ideal for use in presentations, reports, or digital projects that require a modern financial analytic feel.
Powered by 


downloads
Tags:
More
Credit Photo
If you would like to credit the Photo, here are some ways you can do so
Text Link
photo Link
<span class="text-link">
<span>
<a target="_blank" href=https://pikwizard.com/photo/financial-data-visualization-on-black-background/9f6d44fd536c078f3612843523ec8e97/>PikWizard</a>
</span>
</span>
<span class="image-link">
<span
style="margin: 0 0 20px 0; display: inline-block; vertical-align: middle; width: 100%;"
>
<a
target="_blank"
href="https://pikwizard.com/photo/financial-data-visualization-on-black-background/9f6d44fd536c078f3612843523ec8e97/"
style="text-decoration: none; font-size: 10px; margin: 0;"
>
<img src="https://pikwizard.com/pw/medium/9f6d44fd536c078f3612843523ec8e97.jpg" style="margin: 0; width: 100%;" alt="" />
<p style="font-size: 12px; margin: 0;">PikWizard</p>
</a>
</span>
</span>
Free (free of charge)
Free for personal and commercial use.
Author: Authentic Images
Similar Free Stock Images

Premium


Premium

Premium


Premium


Premium

Premium


Premium


Premium

Premium


Premium


Premium

Premium

Premium


Premium


Premium


Premium

Premium


Premium

Premium

Premium


Premium

Premium


Premium

Premium


Premium

Explore More Free Stock Images