
- Home >
- Stock Photos >
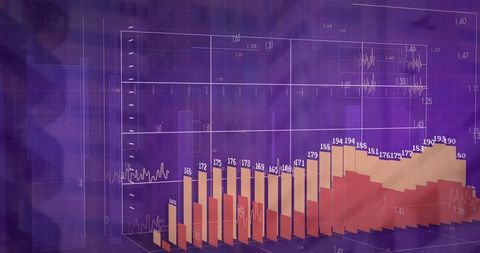
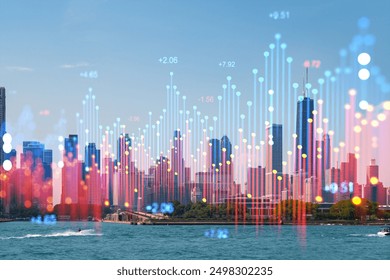
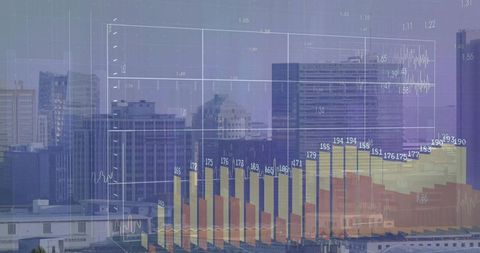
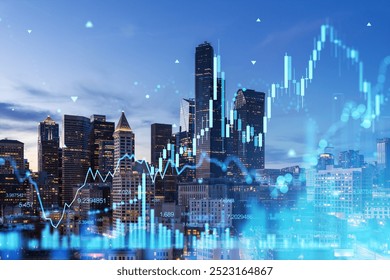
- Financial Data Visualization on Cityscape Background
Financial Data Visualization on Cityscape Background Image

Colorful bar charts and line graphs blend with soft-focus skyscrapers symbolizing innovation and modern finance. Ideal for illustrating finance articles, business presentations, economic analysis, or digital marketing. Emphasizes advancement and interplay of global economic factors.
Powered by  - Get 15% off with code: PIKWIZARD15


downloads
Tags:
More
Credit Photo
If you would like to credit the Photo, here are some ways you can do so
Text Link
photo Link
<span class="text-link">
<span>
<a target="_blank" href=https://pikwizard.com/photo/financial-data-visualization-on-cityscape-background/4ac8fce3c323f1039502638c782d969e/>PikWizard</a>
</span>
</span>
<span class="image-link">
<span
style="margin: 0 0 20px 0; display: inline-block; vertical-align: middle; width: 100%;"
>
<a
target="_blank"
href="https://pikwizard.com/photo/financial-data-visualization-on-cityscape-background/4ac8fce3c323f1039502638c782d969e/"
style="text-decoration: none; font-size: 10px; margin: 0;"
>
<img src="https://pikwizard.com/pw/medium/4ac8fce3c323f1039502638c782d969e.jpg" style="margin: 0; width: 100%;" alt="" />
<p style="font-size: 12px; margin: 0;">PikWizard</p>
</a>
</span>
</span>
Free (free of charge)
Free for personal and commercial use.
Author: Creative Art
Similar Free Stock Images

Premium


Premium

Premium


Premium


Premium


Premium


Premium

Premium


Premium

Premium
Premium

Premium


Premium


Premium


Premium


Premium


Premium


Premium

AI


Premium

Premium


AI


Premium

Premium


Premium


Premium


Premium


Explore More Free Stock Images