
- Home >
- Stock Photos >
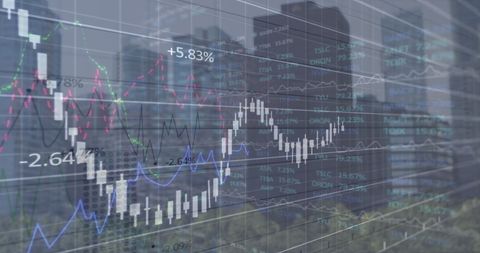
- Financial Data Visualization on Dark Background for Analysis
Financial Data Visualization on Dark Background for Analysis Image

Includes visual representation of financial data processing with charts and graphs on a dark background. Useful for financial presentations, business reports, and articles on stock market trends or data analysis. Ideal for use in professional financial services marketing materials and online content.
Powered by  - Get 15% off with code: PIKWIZARD15


downloads
Tags:
More
Credit Photo
If you would like to credit the Photo, here are some ways you can do so
Text Link
photo Link
<span class="text-link">
<span>
<a target="_blank" href=https://pikwizard.com/photo/financial-data-visualization-on-dark-background-for-analysis/b4e4b5d47954778e3e2981a8492cce93/>PikWizard</a>
</span>
</span>
<span class="image-link">
<span
style="margin: 0 0 20px 0; display: inline-block; vertical-align: middle; width: 100%;"
>
<a
target="_blank"
href="https://pikwizard.com/photo/financial-data-visualization-on-dark-background-for-analysis/b4e4b5d47954778e3e2981a8492cce93/"
style="text-decoration: none; font-size: 10px; margin: 0;"
>
<img src="https://pikwizard.com/pw/medium/b4e4b5d47954778e3e2981a8492cce93.jpg" style="margin: 0; width: 100%;" alt="" />
<p style="font-size: 12px; margin: 0;">PikWizard</p>
</a>
</span>
</span>
Free (free of charge)
Free for personal and commercial use.
Author: Creative Art
Similar Free Stock Images

Premium


Premium


Premium


Premium


Premium


Premium

Premium

Premium


Premium

Premium


Premium


Premium

Premium


Premium


Premium


Premium


Premium


Premium


Premium


Premium

Premium


Premium


Premium


Premium


Premium


Explore More Free Stock Images