1. Home > 
  2. Stock Photos > 
  3. Financial Data Visualization on Digital Display

Financial Data Visualization on Digital Display Image

Financial Data Visualization on Digital Display

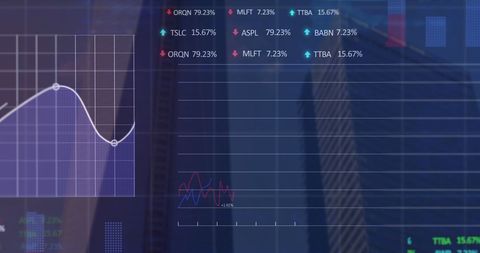
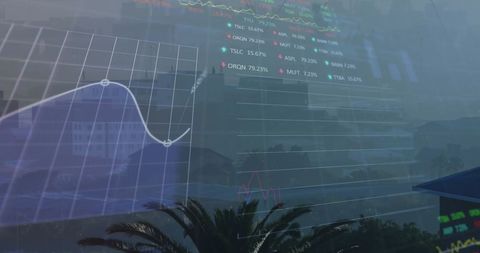
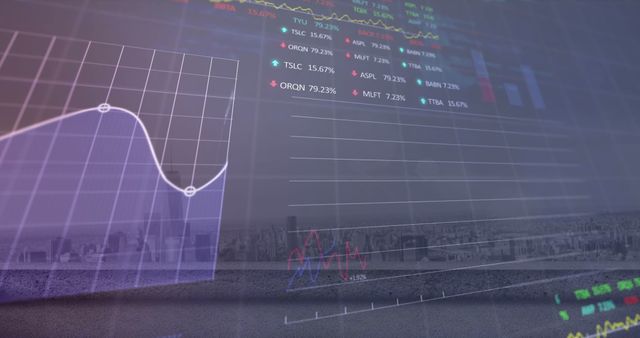
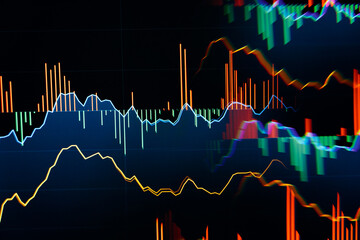
Visual representation of financial data featuring graphs and charts on a digital screen. Ideal for use in financial reports, technology presentations, business intelligence materials, and educational content on economics or finance.

Powered by Adobe logo
Dynamic glowing green stock market graph ascends, symbolizing financial growth and positive economic trends with bokeh lights. - Powered by AdobeAbstract financial stock market graph with candlestick bars isolated on transparent background - Powered by Adobe
Dynamic blue and green digital stock market graph with bar charts and lines on a dark background, representing financial data analysis, investment trends, business growth, and global economy fluctuat - Powered by Adobefinancial chart with stock market graph and silhouette people walking in office with cityscape blurred background - Powered by AdobeTransparent or png stock market investment trading graph growth.Trade business analytics graph and financial chart. - Powered by Adobe

Credit Photo

If you would like to credit the Photo, here are some ways you can do so

Free (free of charge)

Free for personal and commercial use.

Author: Awesome Content

Similar Free Stock Images

Stock Market Analysis with Statistical Data
Premium
Businessman and broker analyzing profit of investment and stock market growth performance forecast and financial growth of business, Investor and stock exchange trading.
Digital Stock Market Data Visualization with Rising and Falling Prices
Abstract Financial Data and Stock Market Analysis Background
Dynamic Financial Data Display with Stock Market Tickers
Financial Data Over Grid Indicating Market Trends and Analytics
Premium
Hand interacting with financial stock market trading candlestick charts analyzing growth opportunities and investment strategies
Digital Financial Data Analysis with Stock Market Insights
Premium
Upward trending financial graph with rising stock market bars and arrow
Premium
Forex colorful diagrams and stock market data with lines and dynamics
Digital Holographic Future Technology and Stock Analysis Graphics
Digital Financial Data Over Dynamic Grid Background
Digital Financial Data Interface with Graphs and Trends
Confetti Falling Over Digital Stock Market Data Visualization
Premium
Green stock market chart displays financial data on digital screen. Candlestick graph indicates trading trends, economic analysis. Technology monitors investment growth, forex prices, market exchange
Graphical Display of Stock Market Trends with Gradient Background
Futuristic Financial Data and Programming Interface
Financial Data Analytics with Graphs and statistics
Financial Data Processing with Graphs and Charts Background
Premium
Magnifying glass highlights business growth chart with upward trend. Generative AI analysis financial success stock increase profit investment statistic performance market economy improvement
Network of Medical Icons and Technical Charts on Digital Interface
Digital Financial Data with Business Charts Revealing Economic Trends
Abstract Financial Data Overlay on Office Building Background
Digital Data Processing and Stock Market Visualization
Premium
Widescreen Abstract financial graph with uptrend line and bar chart of stock market on blue color background
Digital Interface for Data Processing and Global Business Concepts
Dynamic Financial Graphs and Data Fluctuations
Futuristic Stock Market Data Over Cityscape
Financial Data Analyzing with Urban Office Background
Premium
Financial data charts with glowing stock and forex graphs on a dark background illuminated in blue tones. 3D Rendering
Financial Data Analytics with Upward Growth Arrows
Financial Data with Mathematical Equations and Digital Interface
Futuristic Holographic Financial Technology
Premium
stock market visual metaphor concept. A crystal ball displaying financial graph trends on a dark cushion.
Dynamic Financial Data Visualization on Digital Screen
Premium
Perspective view of stock market growth, business investing and data concept with digital financial chart graphs, diagrams and indicators on dark blue blurry background. 3D rendering
Financial Data Analysis and Digital Financial Interface
Digital Financial Dashboard with Data Visualization and Charts
Global Business Analytics with World Map Overlay
Dynamic Financial Data and Graph Analysis on Digital Display
Digital Financial Data with Interactive Graphs and Charts
Futuristic Financial Data Analysis with Global Market Insights
Digital Data Overlay with Cloudback
Digital Financial Data and Stock Market Trends on Screen
Premium
Analyzing real-time financial market trends and stock performance with vibrant candlestick charts and data displayed on a digital screen, symbolizing investment analysis and global economic activity
Digital Graph Decline in Stock Prices with Financial Data Overlay
Digital Data Interface with Cityscape Background for Global Business
Digital Charts Overlay on Misty City Skyline
Complex Data Charts Overlaying Urban Cityscape Landscape
Premium
Using tablet pc, Consultant between bookkeepers and accounting lawyer consultation about asset, balance sheet, stock market statistics and yearly tax law, protect business from bribery.
Digital Data Analysis with Graphs and Analytics Tools
Abstract Concept of Stock Market Data Overlaying Urban Skyline
Global Financial Graphs Over Rotating Digital Globe
Financial Data Processing with Rising Stock Market Graph Overlay
Dynamic Financial Data Display with Stock Trends and Statistics
Digital Network Over Data Processing Background
Digital Finance Data Analysis Over Grid Background
Hybrid Financial Graphs Over Urban Skyline Reflecting Global Opportunities
Premium
Business analyst examining financial data and stock market trends on blue graphs and charts
Futuristic Financial Data Interface Over Cityscape Backdrop
Virtual Cybersecurity Dashboard with Charts and Firewall Concept
Digital Interface Displaying Social Media Engagement over Stock Trends
Analyzing Global Financial Markets with Data Visualization
Digital Arrows and Graphs on Futuristic Technology Screen
Rising Financial Data with Arrows and Graphs
Digital Financial Graphs on Blue Screen Reflecting Data Trends
Cybersecurity Visualization with HTML Code and Analytics Chart
Digital Interface Depicting Abstract Financial Market Data
Stock Market Data and Tall Buildings Low Angle Glimpse
Financial Charts and Data Interfaces on Blue Background
Multilayer Trading Dashboard Overlaying Code Editor, Candlestick Charts and Visualizations
Futuristic Stock Market Analysis with Digital Icons and Graphs
Digital Interface With Cityscape And Financial Data Charts
Premium
Financial growth chart for stock market investment trading.
Global Finance and Data Visualization Interface Background
High-Tech Data Visualization with Futuristic Graphs
Digital Stock Market Interface with data Graphs and Chart
Digital Data Processing with Business Interface Elements on White
Premium
Red and yellow financial graph descending against blue background with bokeh lights stock market trading
Digital Data Analysis with Financial Charts and Graphs
Abstract Financial Data and Digital Math Over Cityscape
Financial Data and Statistics with Digital Charts on Blue Background
Cybersecurity Strategy Analysis for Global Financial Interface
Premium
Dynamic digital financial graph with glowing purple and blue trend lines on dark background displaying market analytics data for investment technology
Digital Finance Data Analysis with Futuristic Grid and Graphs
Dynamic Data Overlays on Urban Cityscape Conveying Financial Markets Progress
Digital Stock Market Trends Overlaid on Abstract Background
Datascape of Stock Market Metrics with Network Connections
Premium
Business financial chart with moving up arrow graph.Financial data charts with glowing stock market graphs.Stock market investment data and analysis finance graph.
Financial Data Processing Overlaying Urban Streetscape
Stock Market Growth Display with Colorful Charts and Graphs
Digital Data Analytics Interface with Financial Graphs and Charts
Holographic Trading Console with Data Visuals and Coding Elements
Premium
A declining red stock market graph with a downward arrow symbolizes a financial crisis and economic recession.
Dynamic Stock Market Analysis with Data and Trends Visualization
Futuristic Cybersecurity Interface with Financial Data Analytics
Digital Graphs and Data Overlays with Global Business Interface
Premium
Abstract glowing big data forex candlestick chart on blurry city backdrop. Trade, technology, investment and analysis concept
Financial Data Analysis on Digital Display
Digital Data Processing Overlay on Urban Cityscape
Digital Financial Data Visualizations with Thumbs Up Icons
Premium
Financial market analysis with stock graph overlay and industrial skyline at dusk
Digital City Overlay and Data Processing Graphics
Futuristic Interface with Graphs Displayed on Transparent Screen
Digital Finance Interface with Data Visualization on Blue Background
Global Finance Data Processing Over Digital Grid Background
Premium
low-angle view of a corporate skyscraper is overlaid with blue and white stock market graphs and trading charts, representing financial technology and economic data.
Digital Financial Data with Graphs and Charts in Virtual Interface
Digital Display of Stock Market Trends and Financial Data
Futuristic Data Visualization of Stock Market Trends
Digital Data and Stock Analysis over Urban Skyscraper Background
Premium
Representation of data analytics,charts, graphs and data driven insights emerging from a sea of information
Financial Data Overlay on Corporate Office Background
Digital Financial Data and Global Connections Conceptual Background
Digital Data Interface with Global Financial Statistics
Digital Financial Data Display with Growing Graph
Premium
stock market trend chart
Premium
Finance trade manager analyzing stock market indicators for best investment strategy, financial data and charts, digital ai
Digital Data Analytics and Financial Insights Interface
Dynamic Financial Data and Graph Arrows in Digital Interface
3D Financial Data Representation with Digital Dashboard Elements
Advanced Financial Data Visualization on Digital Interface
Premium
Young professional woman analyzing stock market data with tablet
Dynamic Stock Market Ticker Display with Rising and Falling Graphs
Statistics and Stock Market Data Over Global Map with Blue Backdrop
Explore More Free Stock Images