
- Home >
- Stock Photos >
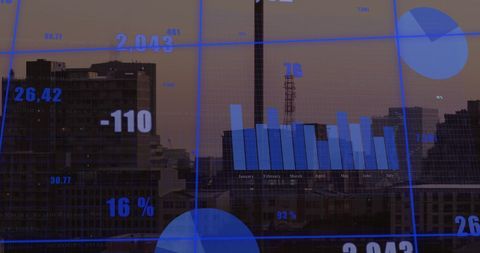
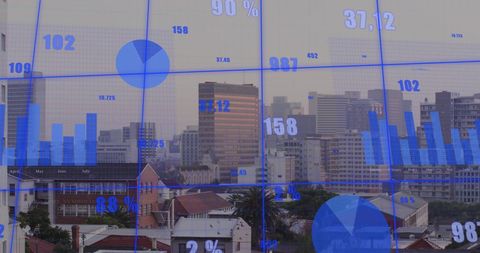
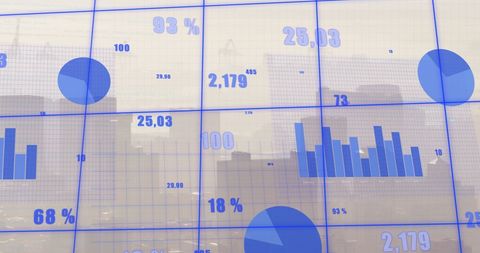
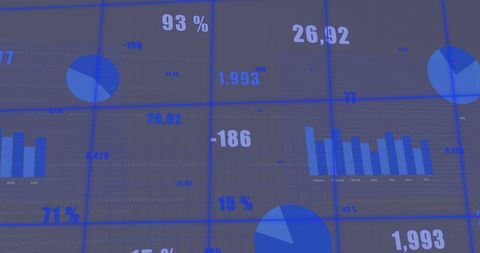
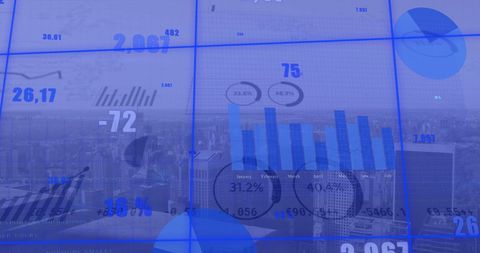
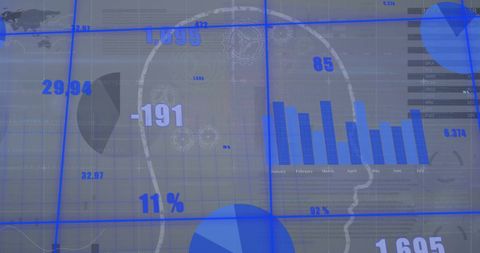
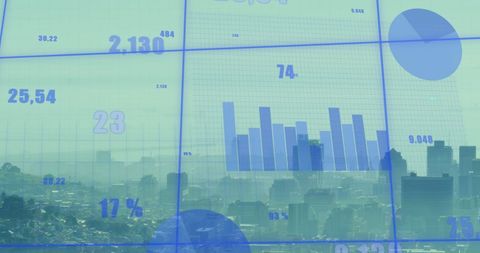
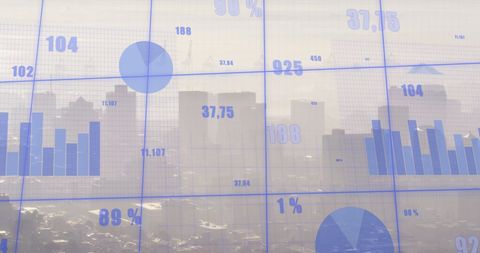
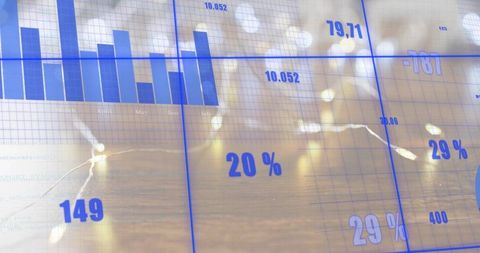
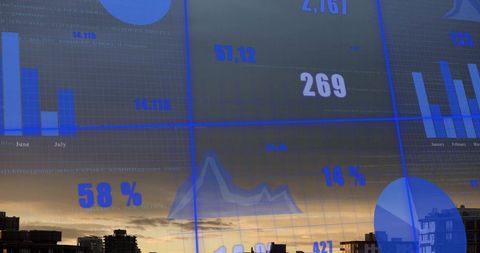
- Financial Data Visualization On Grey Tech Background
Financial Data Visualization On Grey Tech Background Image
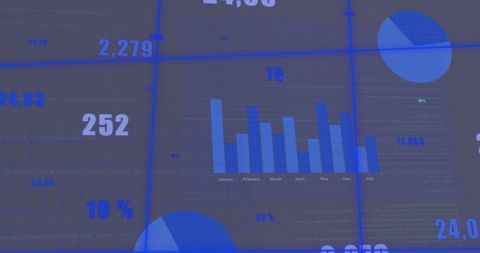
Abstract representation of financial data processing, suitable for showcasing technological advancements in business analytics and digital data management. Displays global economic trends with blue graphs on grey background, ideal for science and technology publications, business reports, presentations, and educational materials in data analysis and computing.
Powered by 


downloads
Tags:
More
Credit Photo
If you would like to credit the Photo, here are some ways you can do so
Text Link
photo Link
<span class="text-link">
<span>
<a target="_blank" href=https://pikwizard.com/photo/financial-data-visualization-on-grey-tech-background/3366c303b7dccf20605a50e0eed565de/>PikWizard</a>
</span>
</span>
<span class="image-link">
<span
style="margin: 0 0 20px 0; display: inline-block; vertical-align: middle; width: 100%;"
>
<a
target="_blank"
href="https://pikwizard.com/photo/financial-data-visualization-on-grey-tech-background/3366c303b7dccf20605a50e0eed565de/"
style="text-decoration: none; font-size: 10px; margin: 0;"
>
<img src="https://pikwizard.com/pw/medium/3366c303b7dccf20605a50e0eed565de.jpg" style="margin: 0; width: 100%;" alt="" />
<p style="font-size: 12px; margin: 0;">PikWizard</p>
</a>
</span>
</span>
Free (free of charge)
Free for personal and commercial use.
Author: People Creations
Similar Free Stock Images

Premium


Premium

Premium


Premium


Premium

Premium


Premium


Premium


Premium


Premium


Premium


Premium

Premium


Premium

Premium


Premium


Premium


Premium


Premium

Premium


Premium


Premium


Premium


Premium


Premium


Explore More Free Stock Images