
- Home >
- Stock Photos >
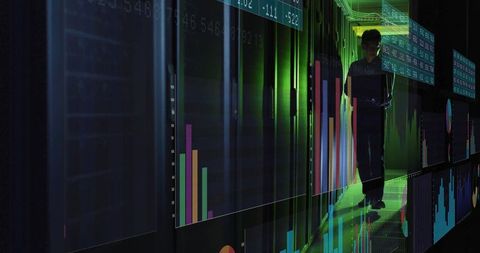
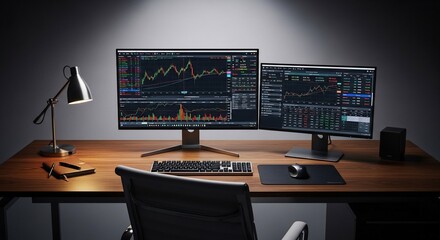
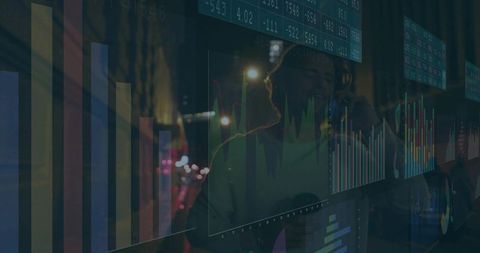
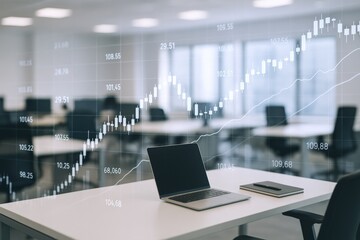
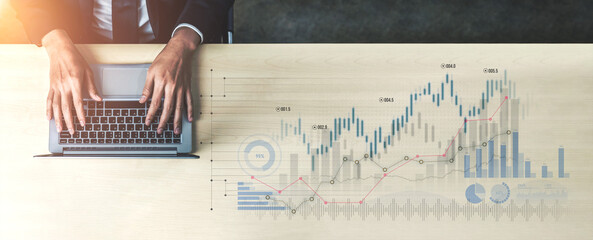
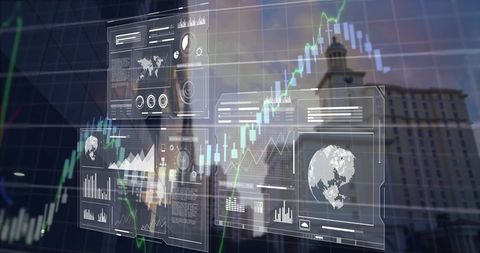
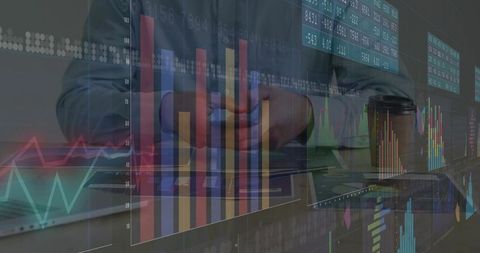
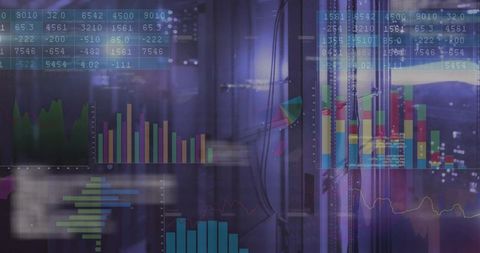
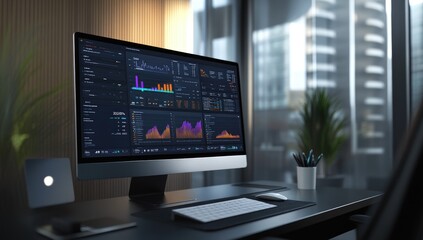
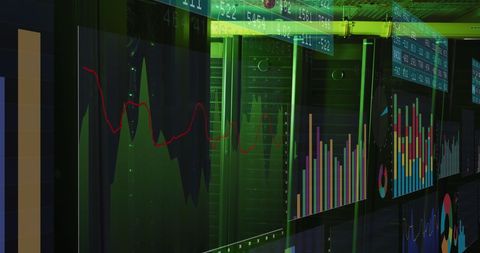
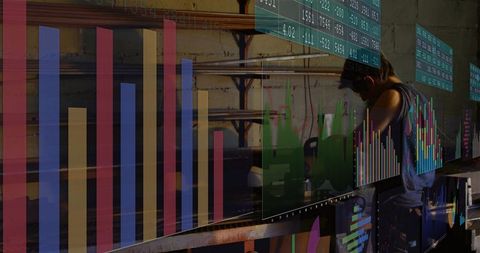
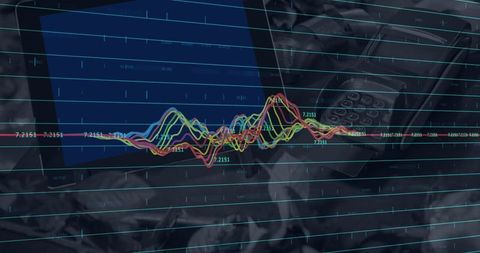
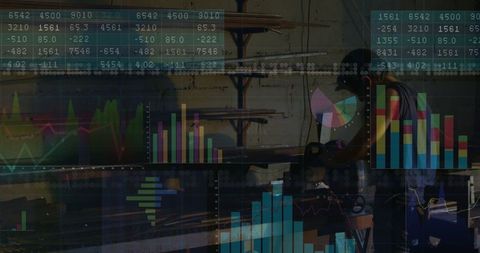
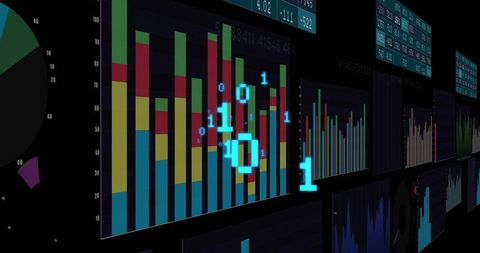
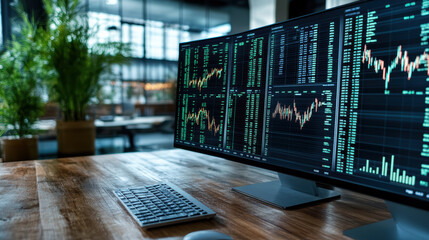
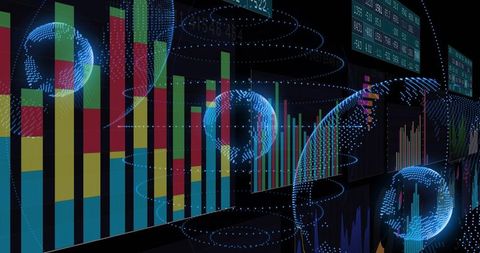
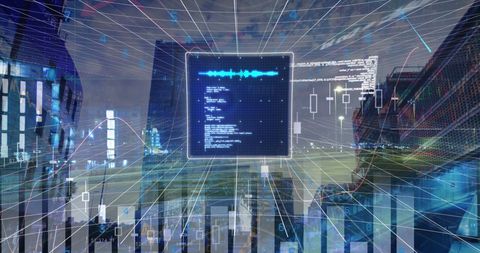
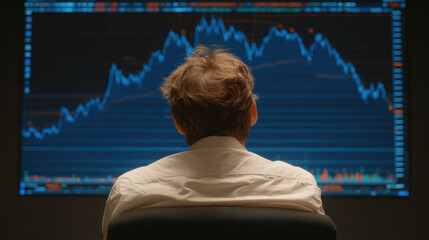
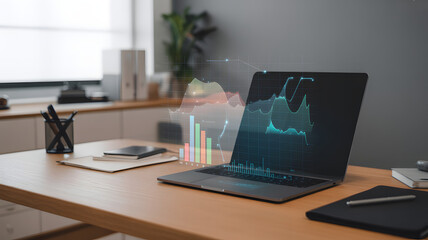
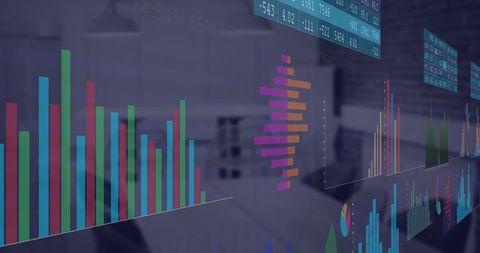
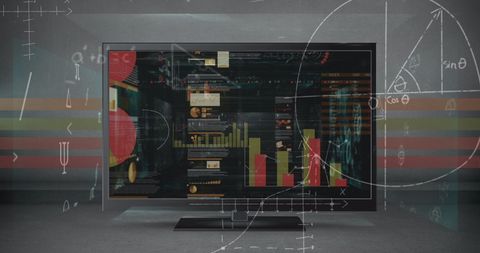
- Financial Data Visualization on Modern Trading Desk
Financial Data Visualization on Modern Trading Desk Image
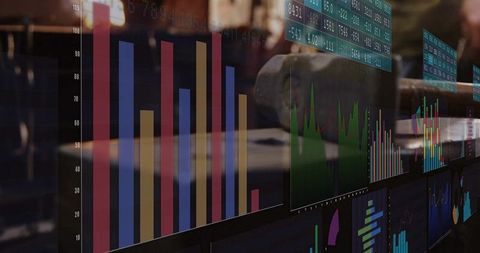
Colorful graphs shown on computer monitors at a trading desk present data metrics and trends, suggesting focused financial analysis and planning. Use in business presentations, finance websites, or educational content illustrating economic study and technological applications in finance sectors.
Powered by 


downloads
Tags:
More
Credit Photo
If you would like to credit the Photo, here are some ways you can do so
Text Link
photo Link
<span class="text-link">
<span>
<a target="_blank" href=https://pikwizard.com/photo/financial-data-visualization-on-modern-trading-desk/2fb0c8f32a5bdfdf7b22d48419da50c5/>PikWizard</a>
</span>
</span>
<span class="image-link">
<span
style="margin: 0 0 20px 0; display: inline-block; vertical-align: middle; width: 100%;"
>
<a
target="_blank"
href="https://pikwizard.com/photo/financial-data-visualization-on-modern-trading-desk/2fb0c8f32a5bdfdf7b22d48419da50c5/"
style="text-decoration: none; font-size: 10px; margin: 0;"
>
<img src="https://pikwizard.com/pw/medium/2fb0c8f32a5bdfdf7b22d48419da50c5.jpg" style="margin: 0; width: 100%;" alt="" />
<p style="font-size: 12px; margin: 0;">PikWizard</p>
</a>
</span>
</span>
Free (free of charge)
Free for personal and commercial use.
Author: Creative Art
Similar Free Stock Images
Premium
Premium

Premium

Premium

Premium


Premium


Premium

Premium
Premium


Premium


Premium


Premium


Premium
Premium


Premium
Premium

Premium


Premium


Premium


Premium

Premium

Premium


Premium


Premium

Premium


Explore More Free Stock Images