- Home >
- Stock Photos >
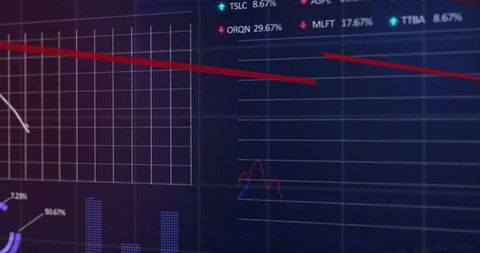
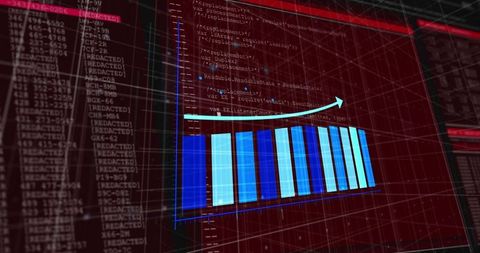
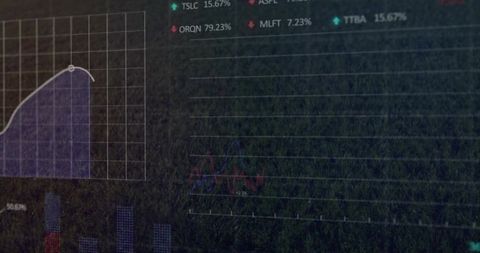
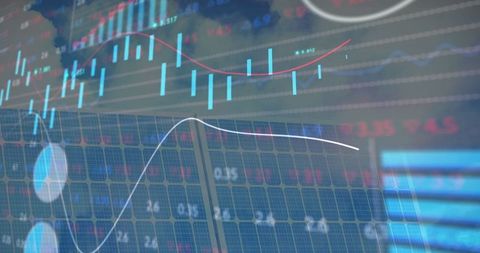
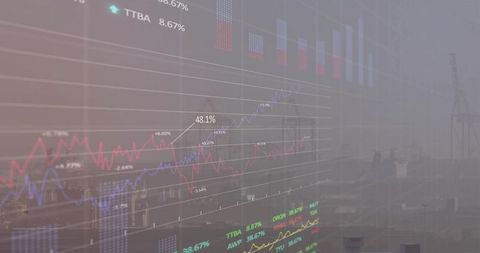
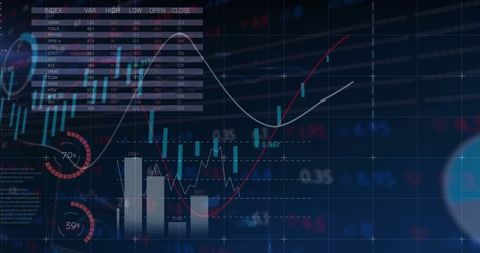
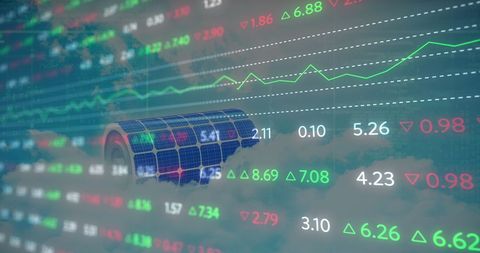
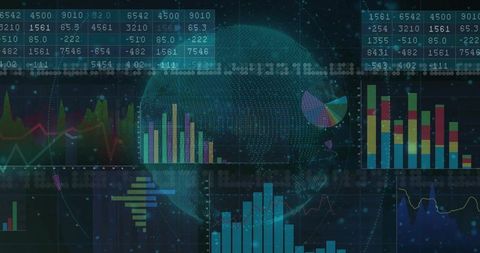
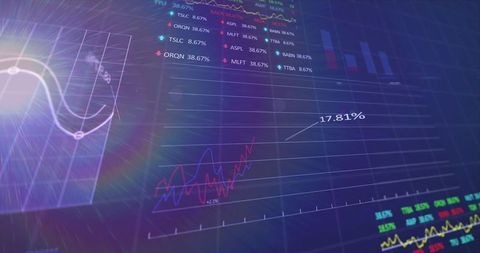
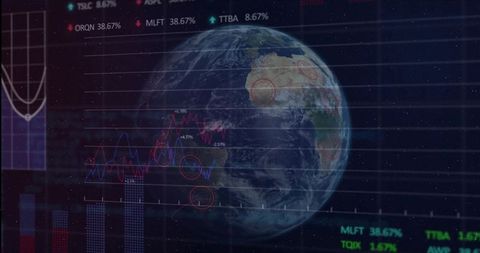
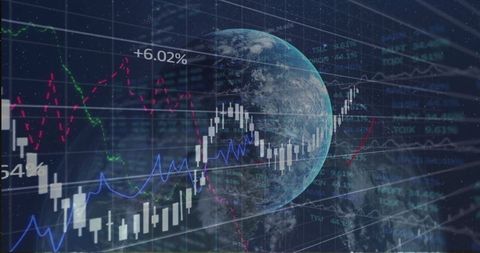
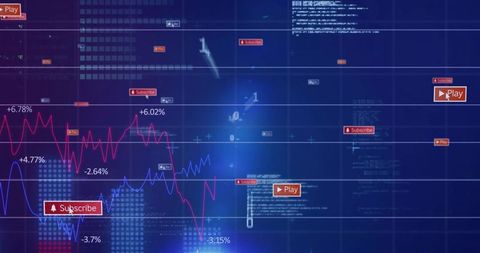
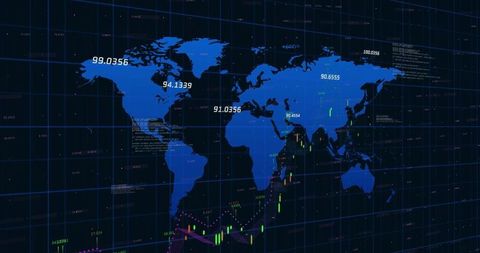
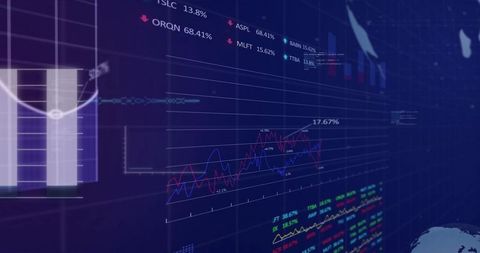
- Financial Data Visualization on Trading Screen Displaying Trends
Financial Data Visualization on Trading Screen Displaying Trends Image
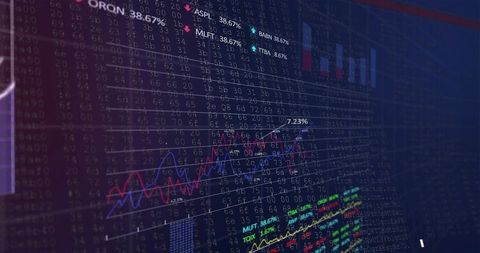
Digital display of financial data, featuring dynamic charts and graphs. Useful for presentations about market analysis, stock trends, or as a background in corporate settings focusing on financial services. Highlights complexity and technological advancement in financial markets.

downloads
Tags:
More
Credit Photo
If you would like to credit the Photo, here are some ways you can do so
Text Link
photo Link
<span class="text-link">
<span>
<a target="_blank" href=https://pikwizard.com/photo/financial-data-visualization-on-trading-screen-displaying-trends/f86aa56c4c60c81c35954ca0d7046c53/>PikWizard</a>
</span>
</span>
<span class="image-link">
<span
style="margin: 0 0 20px 0; display: inline-block; vertical-align: middle; width: 100%;"
>
<a
target="_blank"
href="https://pikwizard.com/photo/financial-data-visualization-on-trading-screen-displaying-trends/f86aa56c4c60c81c35954ca0d7046c53/"
style="text-decoration: none; font-size: 10px; margin: 0;"
>
<img src="https://pikwizard.com/pw/medium/f86aa56c4c60c81c35954ca0d7046c53.jpg" style="margin: 0; width: 100%;" alt="" />
<p style="font-size: 12px; margin: 0;">PikWizard</p>
</a>
</span>
</span>
Free (free of charge)
Free for personal and commercial use.
Author: People Creations