- Home >
- Stock Photos >
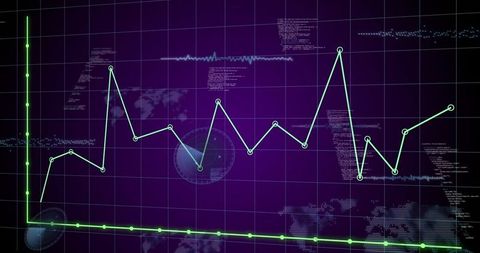
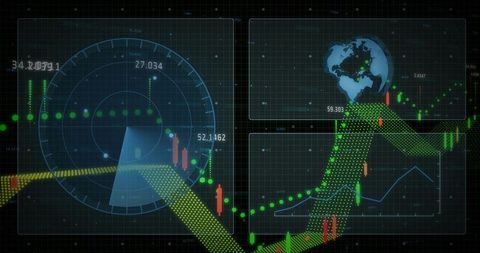
- Financial Data Visualization on World Map with Graph Analytics
Financial Data Visualization on World Map with Graph Analytics Image

Illustration shows world map overlaid with financial data and analytics. Green and red line and bar graphs depict economic trends and market analysis. Concepts of global business, international finance, data crunching, and computational strategies for investment suited to presentations, reports, or educational content about economic development.

downloads
Tags:
More
Credit Photo
If you would like to credit the Photo, here are some ways you can do so
Text Link
photo Link
<span class="text-link">
<span>
<a target="_blank" href=https://pikwizard.com/photo/financial-data-visualization-on-world-map-with-graph-analytics/b25b33374d343153eb799c61c2ea5950/>PikWizard</a>
</span>
</span>
<span class="image-link">
<span
style="margin: 0 0 20px 0; display: inline-block; vertical-align: middle; width: 100%;"
>
<a
target="_blank"
href="https://pikwizard.com/photo/financial-data-visualization-on-world-map-with-graph-analytics/b25b33374d343153eb799c61c2ea5950/"
style="text-decoration: none; font-size: 10px; margin: 0;"
>
<img src="https://pikwizard.com/pw/medium/b25b33374d343153eb799c61c2ea5950.jpg" style="margin: 0; width: 100%;" alt="" />
<p style="font-size: 12px; margin: 0;">PikWizard</p>
</a>
</span>
</span>
Free (free of charge)
Free for personal and commercial use.
Author: Creative Art