1. Home > 
  2. Stock Photos > 
  3. Financial Data Visualization over Equations on Green Chalkboard Background

Financial Data Visualization over Equations on Green Chalkboard Background Image

Financial Data Visualization over Equations on Green Chalkboard Background

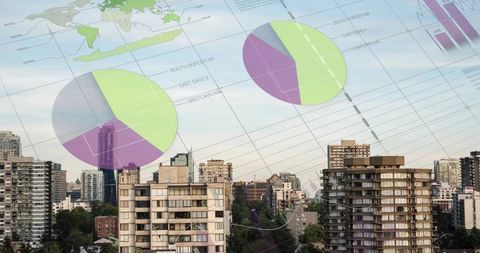
This illustration depicts colorful pie charts integrated with detailed mathematical equations on a green chalkboard-style backdrop. Suited for content related to financial analysis, education in mathematics, and scientific discussions, this creative visual blends data graphs with scholastic elements. Ideal for presentations, educational materials, scholarly articles, or any project emphasizing financial knowledge and learning processes.

Powered by Adobe logo
Digital network security visualization: A bright red padlock icon glows intensely amidst intricate patterns of blue light trails and data points on a dark, futuristic grid.  - Powered by AdobeDigital glowing stock market chart with options trend and index data on a dark background, symbolizing economic growth, trading, and financial technology. - Powered by AdobeAbstract financial data visualization - Powered by AdobeDynamic stock market chart with vibrant blue and pink bars showing upward trend and financial data visualization in a futuristic digital interface - Powered by Adobe3D abstract financial bar chart with glowing data visualization on blue background - Powered by Adobe

Credit Photo

If you would like to credit the Photo, here are some ways you can do so

Free (free of charge)

Free for personal and commercial use.

Author: Authentic Images

Similar Free Stock Images

Abstract Data Visualization with Mathematical Equations and Charts
Premium
The magnifying glass highlighting financial data and market trends on paper.
Digital Analytics and Global Financial Data Visualization
Abstract Overlay of Financial Charts and Statistics
Advanced Data Interface with Stock Market Analytics Graphics
Digital Patterns of Data Analytics with World Map Overlay
Premium
Tractor harvesting wheat in field with financial graphs overlay illustrating agricultural economics
Abstract Financial Data Display with Business People Background
Cityscape Background with Data Analytics Elements Overlay
Statistical Data Visualization Over Aerial Cityscape Background
Colorful Chalkboard with Mathematical Equations
Premium
A focused individual analyzes digital financial data on a futuristic interface, highlighting trends and insights with a finger gesture.
Digital Infographic Overlay with Construction Theme
Global Business Data Visualization Overlay on Professionals
Digital Data Analysis Overlay with Urban Environment
Global Financial Data and Analytics Visualization Concept
Premium
Minimalist wooden bar chart with transparent block for business analytics and financial data visualization
Abstract Business Data Analytics and Statistics Visualization
Global Financial Data Analysis with Interactive Charts
Global Financial Data Visualization with Statistics and Charts
Global Finance Data Concepts Over Urban Landscape
Premium
Stock market data analysis and financial graph on city skyline background for business and investment
Digital Data Analytics Over World Map and Cityscape
Digital Data Visualization Over City Lights Background
Email Notifications Over Financial Data Charts and Graphs
Global Network and Technology Communication Concept Background
Premium
3D abstract financial bar chart with glowing data visualization on blue background
Business Strategy Meeting with Architect Plans and Data Analytics Overlay
Financial Data Processing with Digital Interfaces and Global Connections
Dynamic Social Media Interaction Abstract Concept
Futuristic Data Visualization Dashboard with Glowing Globe
Premium
Professional business photograph of hands interacting with holographic data visualization and financial charts modern analytics technology concept
Digital Visualization of Mathematical Equations with Statistical Graphs
Futuristic Interface with Data Visualizations and Analytics
Premium
Data analyzing and stock market visualization with digital charts, financial dashboards, and performance metrics. Ideal for investment analysis, trading strategy, and economic forecasting.
Business Metrics Overlay on Modern Architecture Canvas
Futuristic Data Visualization in Dark Interface Design
Abstract Digital Interface with Charts and Graphs Overlay
Futuristic Data Visualization with Pie Charts and World Map
Premium
Businessman analyzing financial data on futuristic digital screen with graphs and charts on a dark background, showcasing the finance growth concept.
Digital world: interactive data visualization dashboard
Stock Market Data Overlay Pi Symbol Background
Colorful Pie Charts and Graphs for Digital Data Analysis Presentation
Futuristic Holographic Infographic with Financial Icons
Premium
Digital financial chart with glowing lines and data visualization on a dark background.
Digital Interface with Graphs Over construction Site
Futuristic Digital Interface with Financial Data Graphs
Financial Analytics Over Cityscape with Graphs and Charts
Digital World Map with Data Overlay for Global Networking
Premium
Business Decisions through advanced data visualization and interactive analytics, AI generative
Digital Interface with Mathematical Equations and Pie Charts
Digital Screens Displaying Statistical Charts and Mathematical Equations
Global Financial Data Processing with Charts and Graphs
Abstract Global Data Analytics Interface with Cityscape Background
Premium
Global financial market data visualization
Financial Data with Pie and Bar Graphs on Dark Digital Background
Futuristic Digital Charts and Data Visualization with Global Map
Abstract Data Analytics Interface with Global Charts and Visualizations
Data Analysis Visualization in Modern Urban Office
Premium
Data visualization dashboard with multiple charts and graphs.  Dark blue color scheme.  Complex financial data display
Abstract Digital Data Processing with Global Interface Elements
Abstract Global Technology Background with Mathematical Equations
Futuristic Dashboard with Dynamic Data Visualization and Heatmap
Futuristic Interface Mathematical Data Visualizations Technology
Heart Icons Overlayed on Global Data Processing Interface
Digital Data Processing with Statistical Graphs
Premium
Dynamic 3D bar chart visualization with glowing lights faceless data growth representation defocused red and blue background financial analysis display modern tech environment
Digital Analytics Dashboard with Pinpoint Maps and Graphs
Digital Data Visualization with Futuristic Analytics Interface
Futuristic Interface with Data Highlights and Analytics
Futuristic Financial Data Processing on Digital Screen
Premium
A business professional analyzing futuristic digital graphs and analytics dashboards on a tablet, showcasing data visualization, financial growth, and business intelligence in a modern tech environmen
Businessman Analyzing Digital Global Financial Data
Dynamic Financial Infographic with Moving Green Graph Line
Digital Data Visualization in Urban Business Environment
Multicolored Infographic Interface Over Cityscape
Premium
An abstract visualization of flowing financial data in blue and green.
Global Data Analysis and Visualization Interface
Digital Data Analysis and Visualization Over Modern Cityscape
Digital Financial Data Analytics with Pie Charts and Graphs
Financial Data Visualization with Graphs and Global Map
Premium
Engineer analyzing financial data on tablet in server room
Digital Graphs and Equations on Black Background for Business and Education
Digital Data and Financial Charts on Dark Interface
Digital Data Processing and Statistics Visualization
Global Data Analysis with Pie Charts and Financial Graphs
Premium
Business hand gripping percentage icon emphasizing financial analysis, focused on data visualization and decision-making, World Financial Literacy Day
Dynamic Digital Finance Interface with Statistical Data Displayed
Digital Data Processing Interface with Dynamic Graphs and Statistics
Financial Data Analysis With Overlay On Team In Modern Workspace
Financial Growth and Business Movement in Dynamic Office Environment
Premium
Abstract data visualization of financial market trends.  Dynamic display of stock market analysis
Innovative 3D Pie Charts in Futuristic Analytics Dashboard
Futuristic Digital Analytics Dashboard with Data Visualization
Abstract Visual: Data Analytics and Graph Processing Concept
Digital Financial Analysis in Futuristic Cityscape
Futuristic Digital Data Interface with Charts
Infographic of Global Business Statistics Over Modern Building
Premium
Retail store displaying futuristic data analytics interface
Futuristic Data Analytics Visualization with Global Interface
Business Team Analyzing Financial Graphs with Digital Overlay
Infographic Interface Overlapping Urban Architecture
Financial Data Dashboard with Global Infographic Elements
Premium
Interactive Financial Data Visualization and Predictive Analysis in Digital Platforms.
Futuristic Financial Data Analysis with Holographic Charts
Data Infographics Overlaying Urban Cityscape
Business Analytics with Digital Data Overlay on City Background
Digital Data Analytics and Global Networking Concept
Premium
Business man pointing at financial data visualization on a digital screen
Digital Data Analysis Over Modern Cityscape
Digital Infographics over Cityscape Analyzing Business Growth and Progress
Financial Data and Analytics Visualization in Digital Interface
Digital Infographic Overlay in Modern Urban Skyline
Premium
Dynamic financial data visualization with glowing charts and futuristic network effects
Futuristic Digital Interface with Data Flow and Analytics
Futuristic Data Analytics Overlay on Dark Background
Data Visualization with Financial Graphics on Abstract Background
Data Analytics with Global Financial Charts on Dark Background
Premium
See the 2026 financial growth forecast with a vibrant stock market chart and dynamic data visualization for future business success and investment trends
Digital Data Processing Overlay on City Lights
Abstract Green Chalkboard with Mathematics Formulas Overlay
Digital Data Processing and Global Business Concept Design
Futuristic Data Interface with Global Technology Elements
Premium
Abstract financial data visualization (3)
Futuristic HUD Interface with Neon Graphs and Analytics