
- Home >
- Stock Photos >
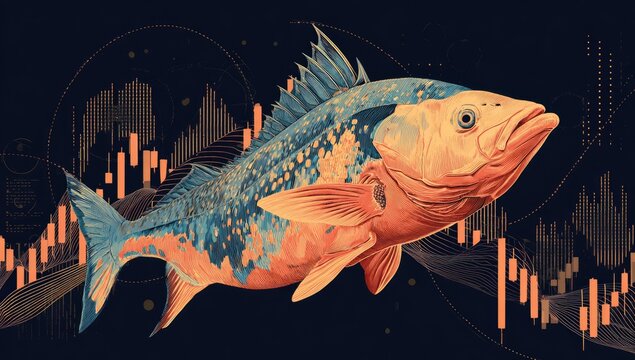
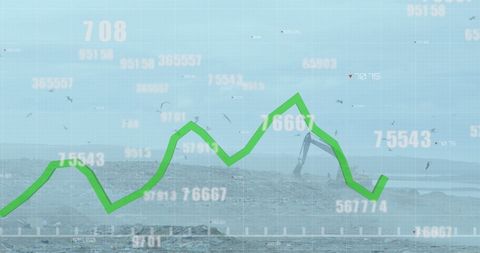
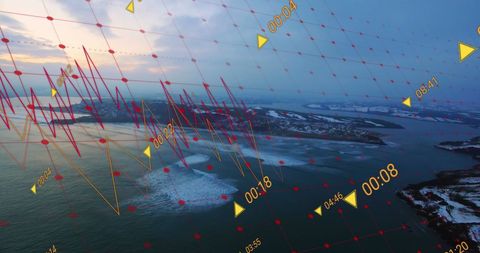
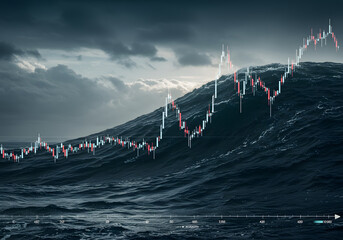
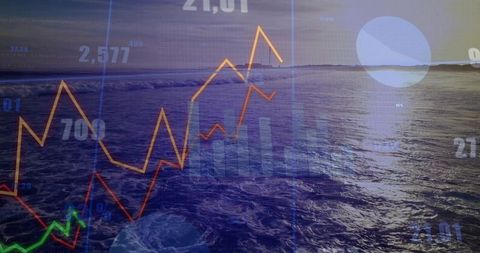
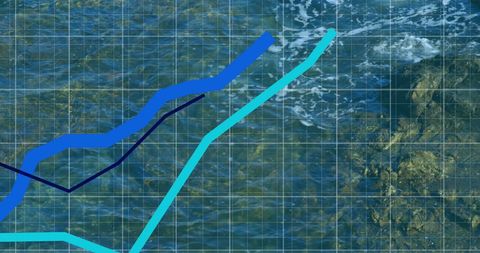
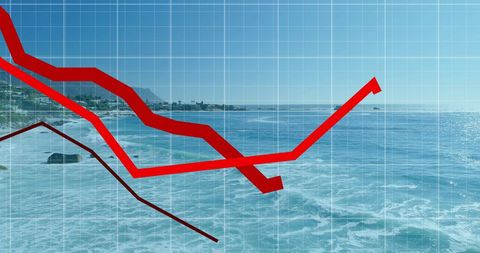
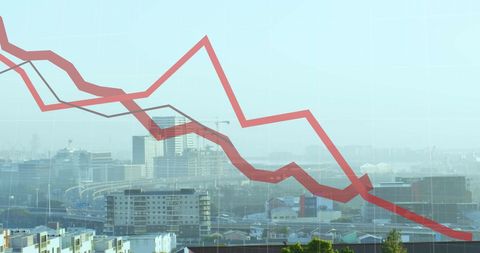
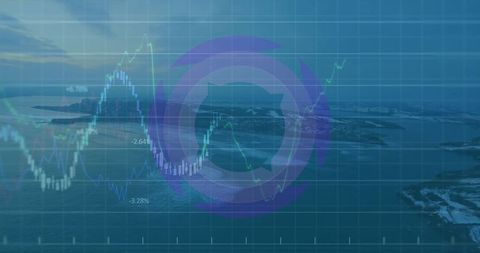
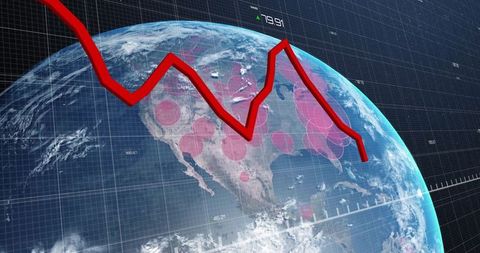
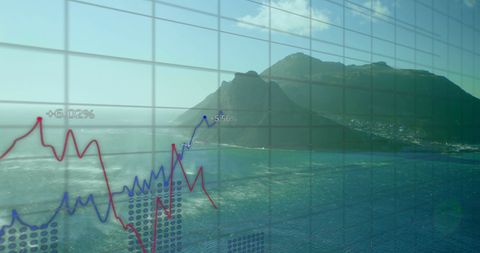
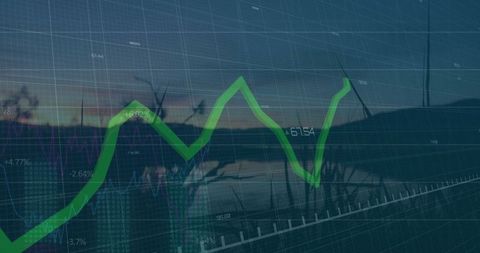
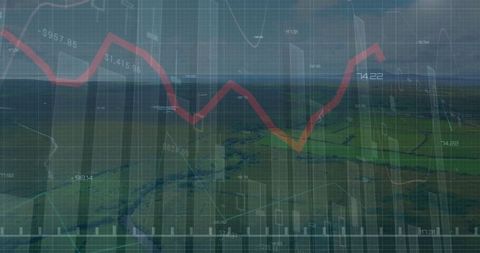
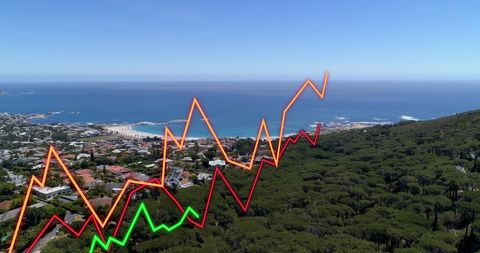
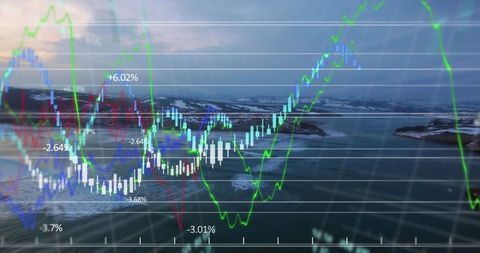
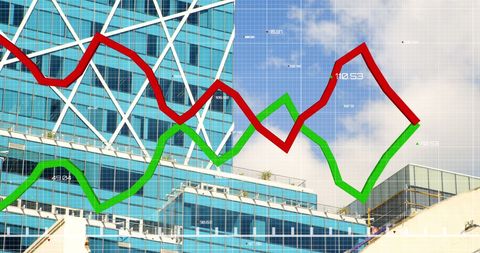
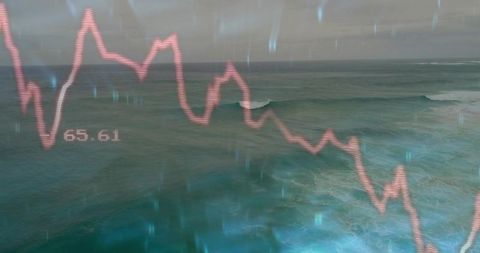
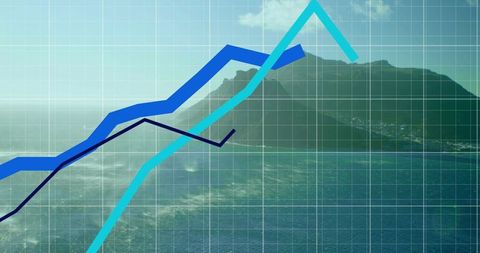
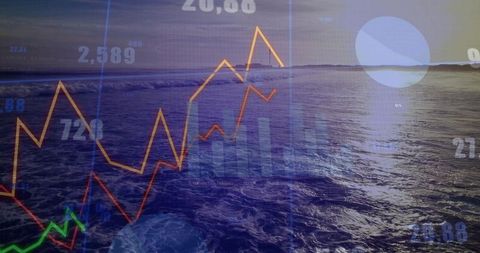
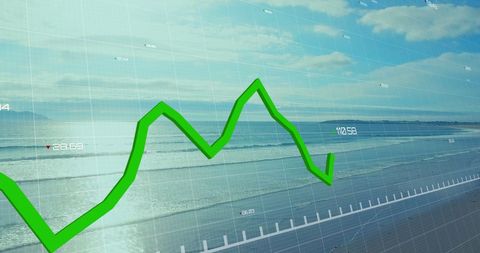
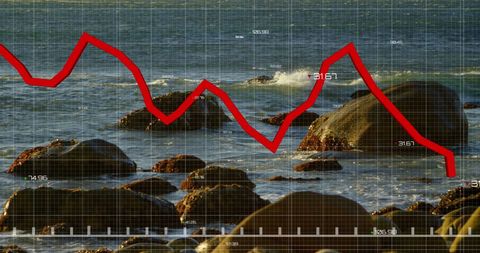
- Financial Data Visualization Over Ocean Scenery
Financial Data Visualization Over Ocean Scenery Image

This unique digital art blends the beauty of nature with finance, depicting a financial graph superimposed over a serene ocean landscape. It represents how global financial trends move and interact with the world at large. Perfect for illustrating concepts of market volatility, environmental finance, or economic change. Useful in presentations, articles, and reports focusing on eco-finance, global market influence, or analyzing business growth trajectories.
Powered by 


downloads
Tags:
More
Credit Photo
If you would like to credit the Photo, here are some ways you can do so
Text Link
photo Link
<span class="text-link">
<span>
<a target="_blank" href=https://pikwizard.com/photo/financial-data-visualization-over-ocean-scenery/1c42b8eb36a097eca60cd3c530efcf41/>PikWizard</a>
</span>
</span>
<span class="image-link">
<span
style="margin: 0 0 20px 0; display: inline-block; vertical-align: middle; width: 100%;"
>
<a
target="_blank"
href="https://pikwizard.com/photo/financial-data-visualization-over-ocean-scenery/1c42b8eb36a097eca60cd3c530efcf41/"
style="text-decoration: none; font-size: 10px; margin: 0;"
>
<img src="https://pikwizard.com/pw/medium/1c42b8eb36a097eca60cd3c530efcf41.jpg" style="margin: 0; width: 100%;" alt="" />
<p style="font-size: 12px; margin: 0;">PikWizard</p>
</a>
</span>
</span>
Free (free of charge)
Free for personal and commercial use.
Author: Creative Art
Similar Free Stock Images

Premium


Premium

Premium


Premium


Premium


Premium


Premium

Premium


Premium


Premium


Premium


Premium


Premium


Premium


Premium


Premium


Premium


Premium


Premium


Premium


Premium


Premium

Premium


Premium

Premium

Explore More Free Stock Images