- Home >
- Stock Photos >
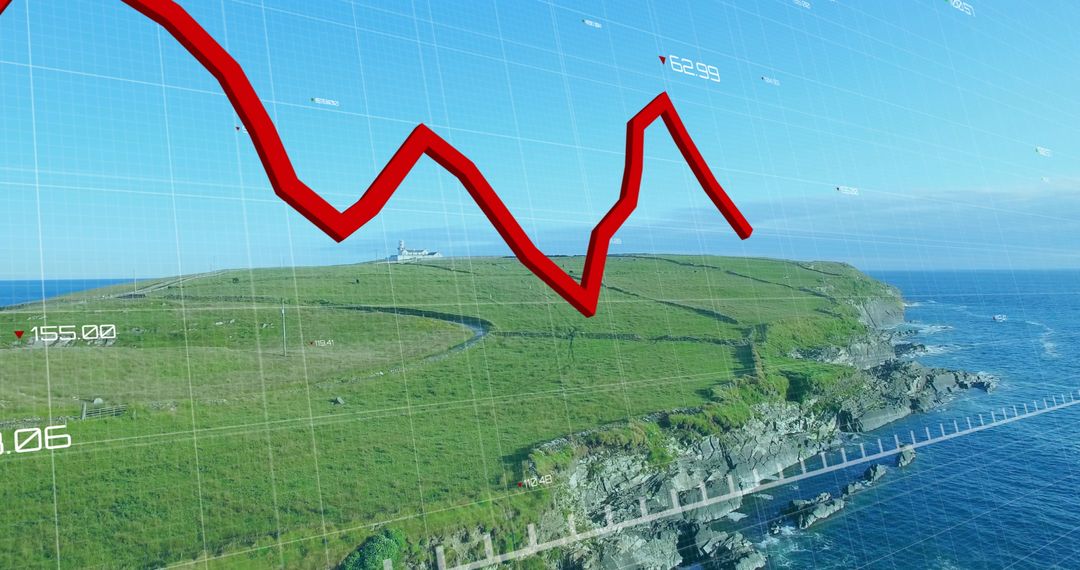
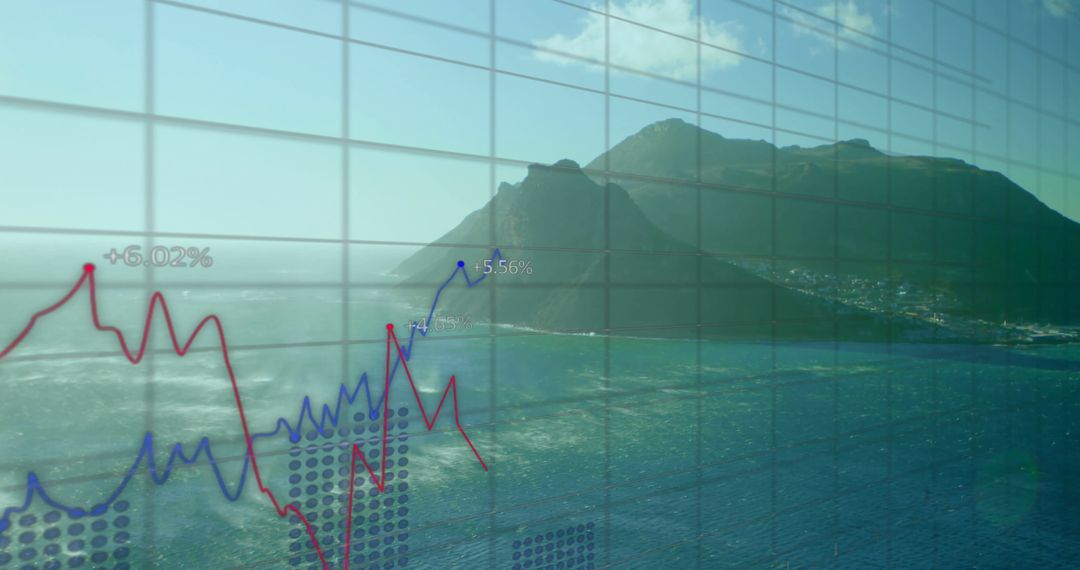
- Financial Data Visualization Over Serene Bay Area Skyscape
Financial Data Visualization Over Serene Bay Area Skyscape Image

Overlay showing a stock market decline with red lines on a blue financial grid, superimposed on a bay view background. Suitable for illustrating topics around finance, investment, economic downturns, stock trading strategies and related educational materials.
Powered by 


2
downloads
downloads
Tags:
More
Credit Photo
If you would like to credit the Photo, here are some ways you can do so
Text Link
photo Link
<span class="text-link">
<span>
<a target="_blank" href=https://pikwizard.com/photo/financial-data-visualization-over-serene-bay-area-skyscape/1e9f94c3ded261e9b2581ad9429f612f/>PikWizard</a>
</span>
</span>
<span class="image-link">
<span
style="margin: 0 0 20px 0; display: inline-block; vertical-align: middle; width: 100%;"
>
<a
target="_blank"
href="https://pikwizard.com/photo/financial-data-visualization-over-serene-bay-area-skyscape/1e9f94c3ded261e9b2581ad9429f612f/"
style="text-decoration: none; font-size: 10px; margin: 0;"
>
<img src="https://pikwizard.com/pw/medium/1e9f94c3ded261e9b2581ad9429f612f.jpg" style="margin: 0; width: 100%;" alt="" />
<p style="font-size: 12px; margin: 0;">PikWizard</p>
</a>
</span>
</span>
Free (free of charge)
Free for personal and commercial use.
Author: People Creations
Similar Free Stock Images

Premium


Premium


Premium


Premium


Premium


Premium


Premium


Premium


Premium


Premium


Premium


Premium


Premium


Premium


Premium


Premium


Premium


Premium


Premium


Premium


Premium


Premium


Premium


Premium