
- Home >
- Stock Photos >
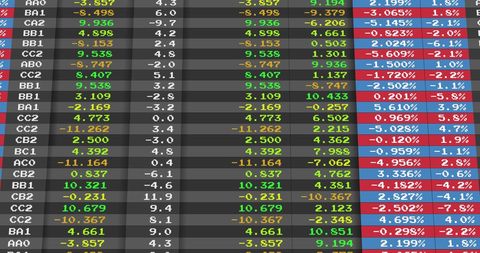
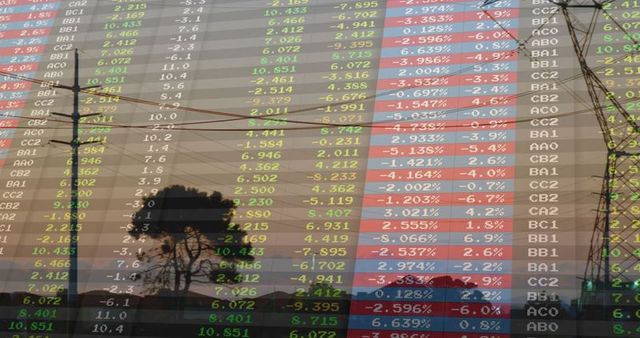
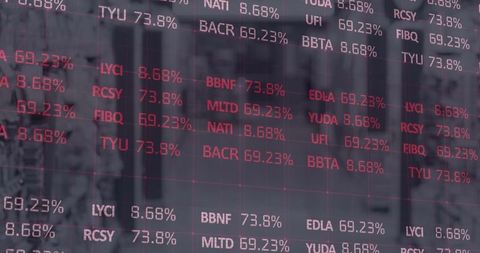
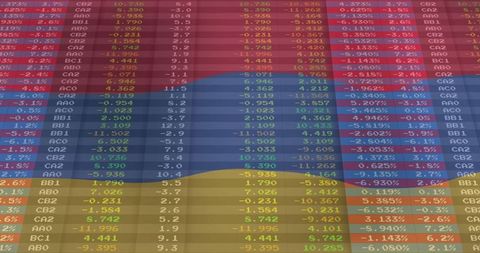
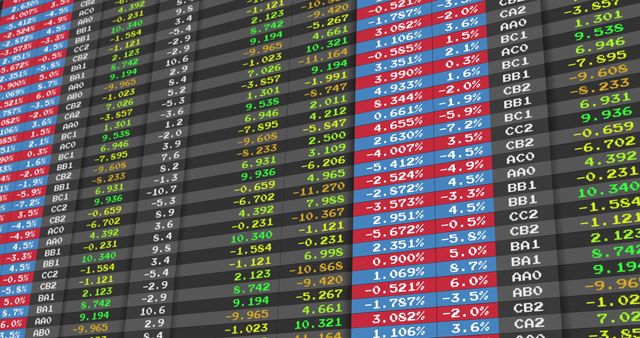
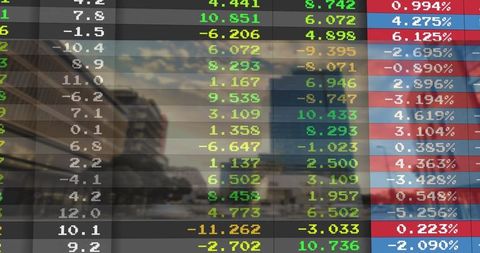
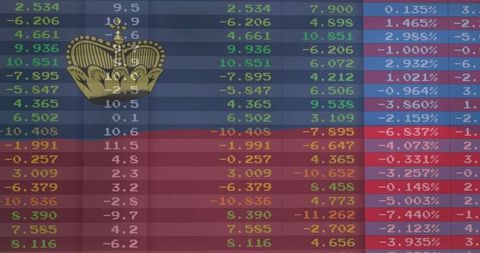
- Financial Data Visualization Over Skylines with Colored Tickers
Financial Data Visualization Over Skylines with Colored Tickers Image

Skylines with data panel overlay showcasing modern interpretation of financial trends. Useful for representing the interconnectedness of finance and urban infrastructure. Ideal for articles and blogs about technology in finance, stock analysis, city-based trading, and corporate workspace efficiency.
Powered by 


downloads
Tags:
More
Credit Photo
If you would like to credit the Photo, here are some ways you can do so
Text Link
photo Link
<span class="text-link">
<span>
<a target="_blank" href=https://pikwizard.com/photo/financial-data-visualization-over-skylines-with-colored-tickers/bd90771feabf24956a70b00482536bcb/>PikWizard</a>
</span>
</span>
<span class="image-link">
<span
style="margin: 0 0 20px 0; display: inline-block; vertical-align: middle; width: 100%;"
>
<a
target="_blank"
href="https://pikwizard.com/photo/financial-data-visualization-over-skylines-with-colored-tickers/bd90771feabf24956a70b00482536bcb/"
style="text-decoration: none; font-size: 10px; margin: 0;"
>
<img src="https://pikwizard.com/pw/medium/bd90771feabf24956a70b00482536bcb.jpg" style="margin: 0; width: 100%;" alt="" />
<p style="font-size: 12px; margin: 0;">PikWizard</p>
</a>
</span>
</span>
Free (free of charge)
Free for personal and commercial use.
Author: Awesome Content
Similar Free Stock Images
Premium


Premium


Premium


Premium

Premium


Premium


Premium


Premium

Premium

Premium


Premium


Premium


Premium

Premium


Premium


Premium


Premium


Premium


Premium


Premium


Premium

Premium


Premium


Premium


Premium


Explore More Free Stock Images